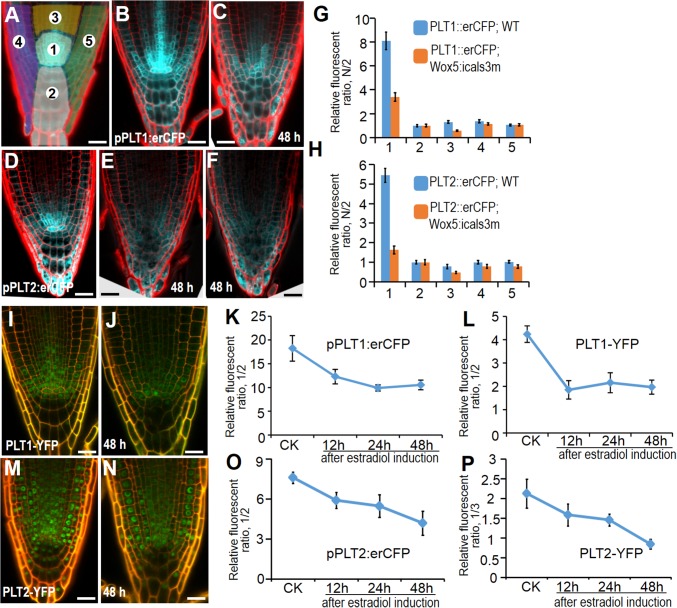
Fig. 4.
PLT gradient is disrupted in pWOX5:icals3m expressing roots. (A) The scheme depicting sections for the fluorescence ratio measurement. Whole root tip was divided into five sections as marked. (B and C) The expression of pPLT1:erCFP in WT (B) and pWOX5:icals3m (C). (D–F) The expression of pPLT2:erCFP in WT (D) and pWOX5:icals3m (E and F). (G and H) Quantitative comparison of PLT1:erCFP (G) and PLT2:erCFP (H) in different sections between WT (blue) and pWOX5:icals3m (orange). The numbers along the horizontal axis represent each section, and the value of the vertical axis represents the relative fluorescence ratio of each section that was normalized to section 2 (labeled as N/2). (I and J) The expression of pPLT1:PLT1-YFP in WT (I) and pWOX5:icals3m (J). (M and N) The expression of pPLT2:PLT2-YFP in WT (M) and pWOX5:icals3m (N). (K–P) Time-course analysis of pPLT1:erCFP (K), pPLT1:PLT1-YFP (L), pPLT2:erCFP (O), and pPLT2:PLT2-YFP (P) in section 1 (normalized to section 2 or 3). CK represents the control root. Different induction times of pWOX5:icals3m roots are marked. Data are average values ± SE of three independent experiments with >15 roots per treatment. (Scale bars, 20 μm.)

