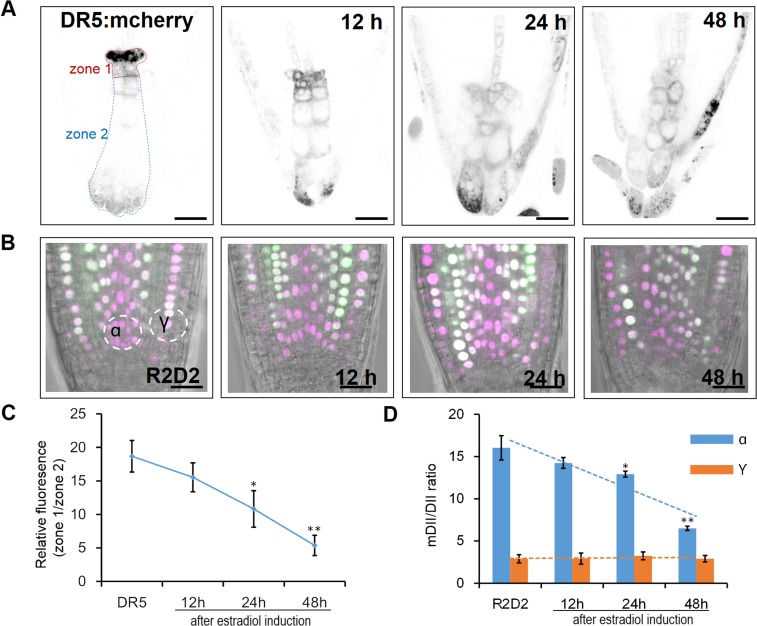
Fig. S5.
Time-course analysis of auxin markers in pWOX5:icals3m roots. (A) DR5:mCherry expression pattern in the control (Left) and in pWOX5:icals3m roots. Times after induction are marked. (B) R2D2 expression pattern in the control (Left) and in pWOX5:icals3m roots. Times after induction are marked. (C) Quantitative measurements of auxin markers shown in A. The expression DR5:mCherry in the root tip was divided into zone 1 (including the QC and CSC) and zone 2 (columella cells). The relative fluorescence of each section was measured and calculated as zone1/zone2 (shown in A). (D) Quantitative measurements of auxin markers shown in B. The ntdTomato/Venus relative fluorescence of two circle sections (α and γ, shown in B) was measured and calculated. Data are average values ± SE of >15 roots per treatment. Asterisks indicate Student’s t test significant difference between WT and pWOX5:icals3m (**P < 0.01; *P < 0.05). (Scale bars, 20 μm.)

