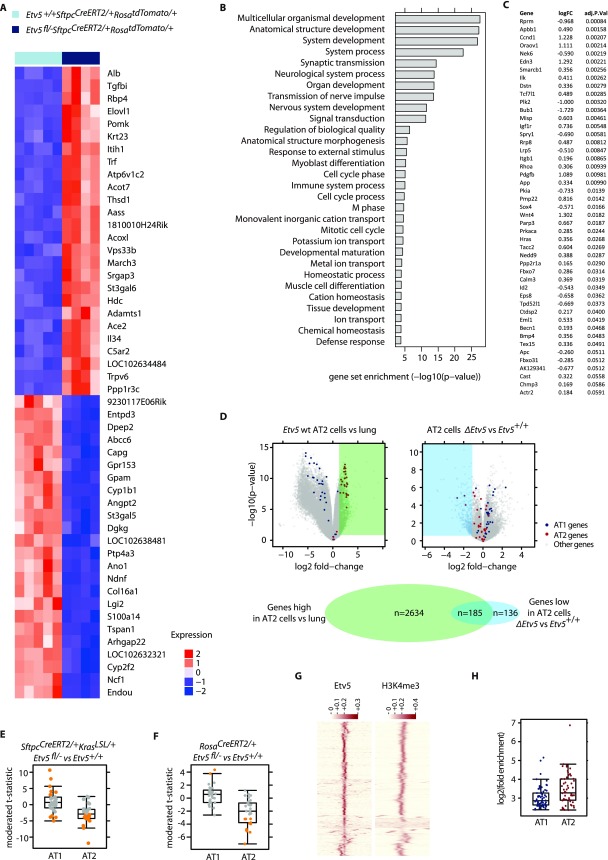
Fig. S2.
Gene-expression changes caused by Etv5 deficiency. (A) Heat map of the top 50 most differentially expressed genes in Etv5+/+ SftpcCreERT2/+ RosatdTomato/+ tdTomato+ cells compared with Etv5fl/- SftpcCreERT2/+RosatdTomato/+ tdTomato+ cells at 7 d after the last dose of tamoxifen. (B) Gene set enrichment analysis identifying Gene Ontology Biological Process gene sets that show significant enrichment when comparing differential expression based on RNA-seq fromEtv5+/+ SftpcCreERT2/+ RosatdTomato/+ and Etv5fl/- SftpcCreERT2/+RosatdTomato/+ tdTomato+ cells. (C) Cell-cycle genes identified by Gene Ontology analysis that are significantly down-regulated in Etv5fl/− SftpcCreERT2/+RosatdTomato/+ tdTomato+ cells compared with Etv5+/+ SftpcCreERT2/+ RosatdTomato/+ cells. (D) Volcano plots indicating the difference in gene expression between tdTomato+ cells and whole-lung tissue (Left) and between ΔEtv5 and Etv5+/+ tdTomato+ cells (Right). There were 2,819 genes more highly expressed in tdTomato+ cells than in whole-lung tissue (Benjamini–Hochberg adjusted P < 0.05, fold-change >2), and 321 genes were expressed at lower levels in ΔEtv5 tdTomato+ cells than in wild-type cells (Benjamini–Hochberg adjusted P < 0.05, fold-change is less than −2). The Venn diagram shows the overlap of these two gene sets. (E) Single-cell qRT-PCR of AT1 and AT2 marker genes. Each point represents one gene and shows the t statistic comparing Etv5+/+ tdTomato+ and ΔEtv5 tdTomato+ cells isolated from tamoxifen-treated SftpcCreERT2/+KrasLSL/+ mice as in Fig. 3A. Genes that are significantly changed (Benjamini–Hochberg adjusted P < 0.05) are shown in orange. (F) Single-cell qRT-PCR of AT1 and AT2 marker genes. Each point represents one gene and shows the t statistic comparing Etv5+/+ lineage− CD24− Epcam+ and ΔEtv5 lineage− CD24− Epcam+ cells isolated from tamoxifen-treated RosaCreERT2/+ mice. Genes that are significantly changed (Benjamini–Hochberg adjusted P < 0.05) are shown in orange. (G) Heatmap showing the row scaled signal for Etv5 and H3k4me3 on 1,000 randomly selected ETV5 sites on a 5 kb+/5 kb− window. The H3k4me3 window is centered on the Etv5 binding site. (H) The graph indicates the degree of enrichment of ChIP-seq–identified peaks adjacent to the AT1 and AT2 marker genes compared with background calculated by Macs2.

