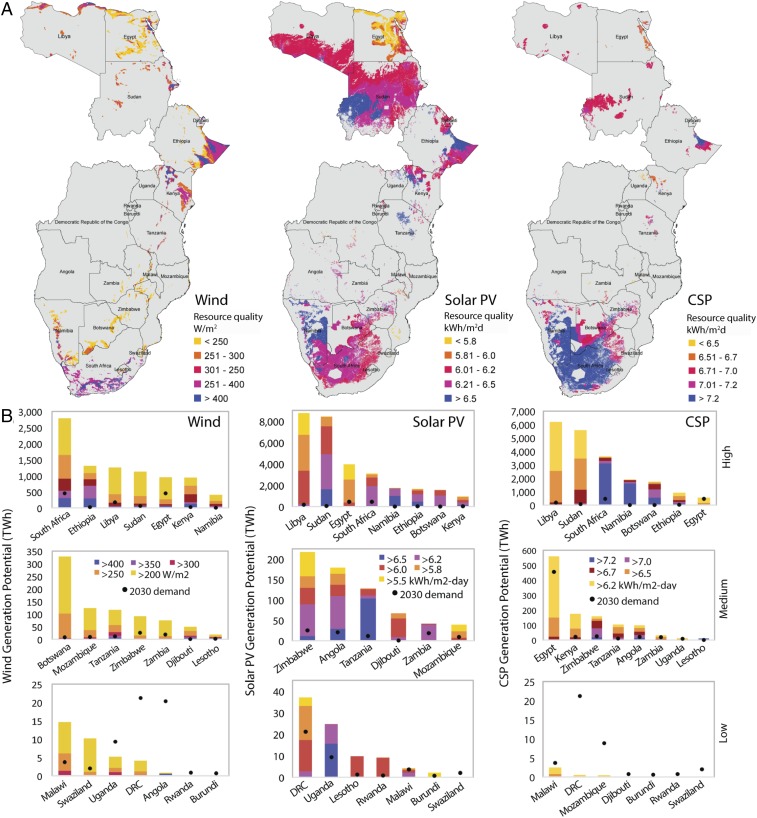
Fig. 1.
Location and potential (TWh) of each country’s renewable resources within the SAPP and EAPP. (A) Maps show the location and quality of renewable energy potential. (B) Corresponding bar charts for each technology show the generation potential (TWh) of each resource quality range (in kWhm−2⋅d−1 for insolation and m/s for wind speed) for each country. Countries are sorted by generation potential (high, medium, low). The 2030 demand for each country, as projected by the EAPP and SAPP Master Plans, is provided as a reference point (2, 3).

