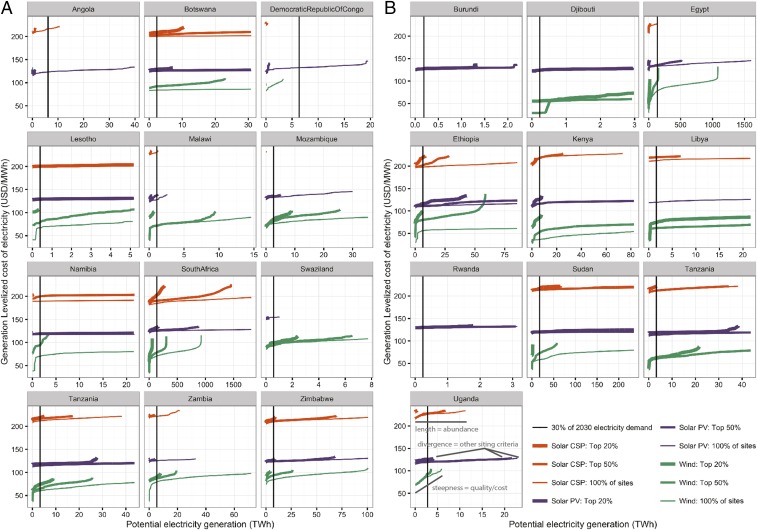
Fig. 2.
Multicriteria project opportunity area supply curves for countries in the SAPP and EAPP. Supply curves show the cumulative potential of all wind, solar PV, and CSP sites and those that meet the top 20% and 50% of criteria values within the SAPP (A) and EAPP (B). Project opportunity areas are sorted by generation LCOE. Vertical lines show 30% of each country’s projected electricity demand in 2030. Criteria values include transmission distance, distance to nearest load center, and human footprint score. For example, the quantities of CSP potential in the top 50% and all sites in Uganda meet 2030 targets, and the difference between solar PV supply curves shows that although the top 20% of sites are limited in Uganda, they are sufficient to meet 2030 targets. Note that the x axis varies between countries whereas the y axis is fixed. For countries with large potential, the maximum value of the x axis is six times the anticipated 2030 demand. Tanzania is a member of both power pools. The top 20% or 50% of sites are selected relative to other sites within the power pool. Assumptions for LCOE, including discount rate, are consistent across countries.

