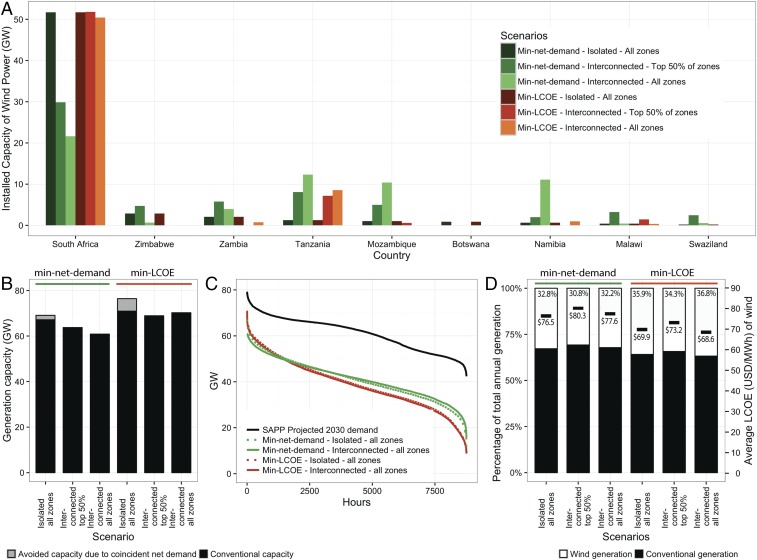
Fig. 3.
Impacts of wind build-out scenarios for the SAPP in 2030. (A) Distribution of installed wind capacity among countries in the SAPP. (B) Conventional installed capacity needed to meet the highest hourly net demand within 2030. (C) The hourly net electricity demand in gigawatts (GW) sorted from highest to lowest compared with the projected 2030 electricity demand. (D) The percentage of annual electricity from wind and nonwind generation (primary y axis and bar plot) compared with the average LCOE of wind generation (secondary y axis and horizontal lines).

