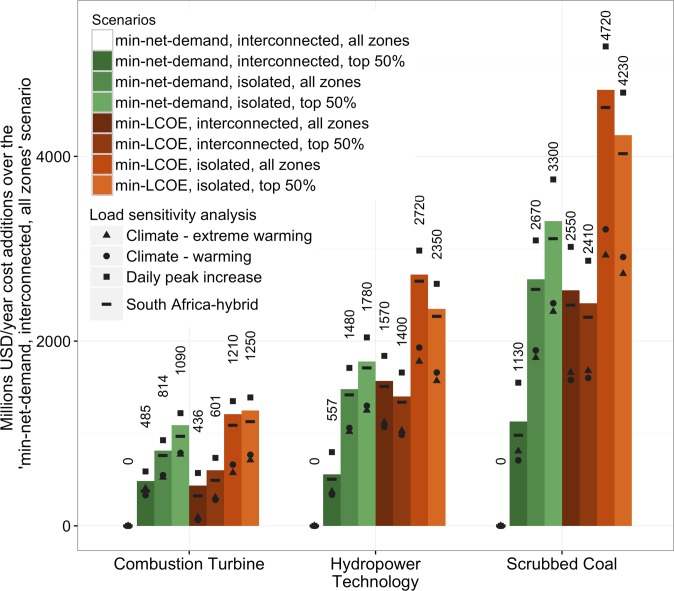
Fig. 5.
System cost additions compared with the least-cost scenario. For each technology, the bars show the difference in system costs between each scenario and the least-cost scenario (Min-Net-Demand, Interconnected, All-Zones). System costs include the additional energy and/or conventional capacity required in each scenario. The set of four points for each bar shows results from load sensitivity analyses of four plausible future load growth scenarios (SI Appendix, Figs. S10 and S11).

