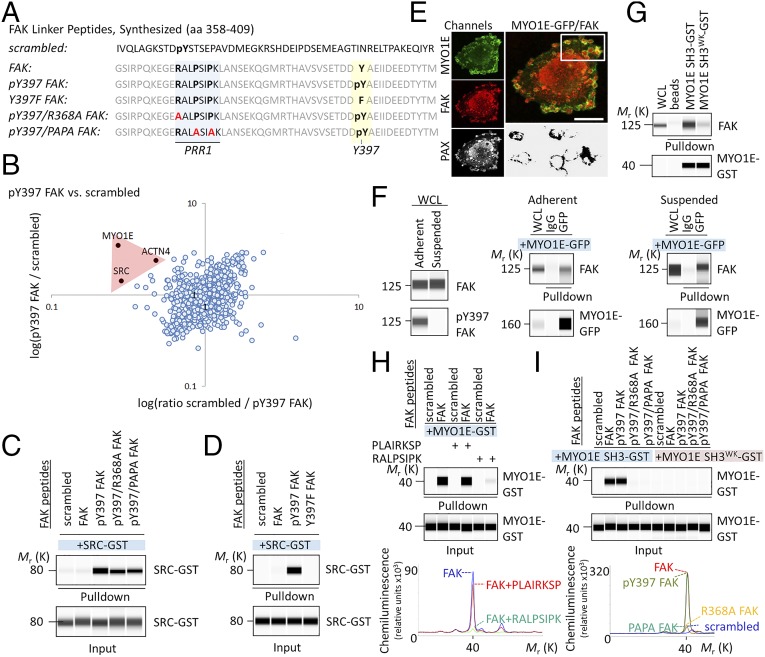
Fig. 2.
MYO1E binds FAK at PRR1. (A) Amino acid (aa) sequence of synthesized FAK peptides. (B) Scatter plot of phospho-Y397 FAK peptide versus scrambled peptide pull-down results. The log SILAC ratio of proteins identified with at least two unique peptides in each mass spectrometry run is plotted as the forward pull-down (x axis) against the reverse labeling pull-down (y axis). Specific interaction partners show inverse ratios between forward and reverse experiments, grouping them into the upper left quadrant. (C and D) Pull-down of recombinant SRC-GST by FAK peptides. (E) Immunostaining of MYO1E-GFP–expressing WM858 cells. (Lower Right) Area of MYO1E/FAK colocalization. (Scale bars, 10 μm.) (F) Coimmunoprecipitation of FAK by MYO1E-GFP from whole-cell lysates (WCL) of adherent or suspended WM858 cells. (G) Pull-down assay demonstrating MYO1E SH3 binding to FAK. A tryptophan (W) to lysine (K) mutation at position 1088 (W1088K; WK) in MYO1E SH3 prevented MYO1E SH3 binding to FAK. (H) FAK PRR1 peptide RALPSIPK, but not scrambled PLAIRKSP, blocks FAK interaction with MYO1E SH3. Chemiluminescence spectra for the indicated pull-downs are shown. (I) Pull-down of recombinant MYO1E SH3-GST by FAK peptides. Chemiluminescence spectra are shown. Immunoblots are pseudoimages generated by ProteinSimple Compass software.

