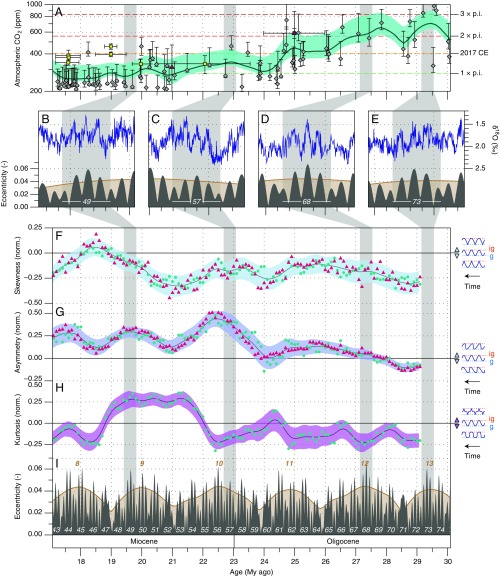
Fig. 3.
Nonsinusoidal glacial−interglacial cycle properties. (A) Atmospheric CO2 proxy estimates for the Oligo-Miocene and their long-term smooths (turquoise line and area; SI Methods) through the reconstructed values and their maximum and minimum error estimates (black error bars). Gray diamonds represent phytoplankton CO2 estimates, yellow squares are based on stomata, and purple-red triangles represent CO2 estimates based on paleosols (6, 7). Multiplication factors on the right refer to preindustrial (p.i.) CO2 concentrations of 278 ppm. CE, Common Era. (B−E) Four 405-ky-long intervals with exceptionally strong ∼110-ky cycles in benthic δ18O, plotted against eccentricity and its ∼2.4-My component (+0.02 to aid visibility). These intervals occur during (B) the Early Miocene, contemporaneous with 405-ky Eccentricity Cycle 49; (C) the Oligo-Miocene transition, Cycle 57; (D) the mid-Oligocene, Cycle 68; and (E) the Early Oligocene, Cycle 73 (white italic numbers). For B−E only, long ticks on the age axis indicate 500-ky steps, and short ticks indicate 100-ky steps. (F–H) Nonsinusoidal glacial−interglacial cycle properties. (F) Skewness, (G) asymmetry, and (H) kurtosis of the Site 1264 benthic δ18O record quantified over a 2-My-long sliding window using standard (turquoise circles) and bispectral (purple-pink triangles) methods (SI Methods). The colored areas indicate the 2σ upper and lower ranges of the cycle geometries. (I) Earth’s orbital eccentricity (8) and its ∼2.4-My component (+0.02 to aid visibility) marked by brown bold italic cycle numbers. Vertical gray bars are as in Fig. 1. To the right of F−H, the corresponding cycle shapes are depicted, and the direction of time is indicated; ig, interglacial; g, glacial.

