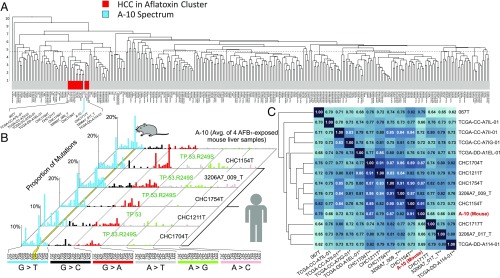
Fig. 4.
Comparison of the mutational patterns of human liver cancer with the murine AFB1 exposure spectrum. (A) Dendrogram showing the results of unsupervised clustering of 314 human HCCs and murine spectrum A-10. The red cluster indicates the 13 human HCC samples with closest cosine similarity to A-10 (the blue vertical stripe). (B) HRMS of A-10 and the mutational spectra of the five human HCCs most similar to A-10 identified in A. The yellow stripe highlights the G:C→T:A hotspot in the 5′-CGC-3′ context. All five humans harbored TP53 mutations, and four specifically carried the TP53.R249S mutation. (C) Cosine similarity matrix of the red cluster from A with the murine spectrum A-10. The numbers in the matrix (also the darkness of the shade of blue) indicate the cosine similarity between compared samples. Asterisks on the bottom of the matrix indicate TP53 status (*known mutation in TP53, but not at position 249; **TP53.R249S mutation; no asterisk indicates TP53 wild type or status unknown).

