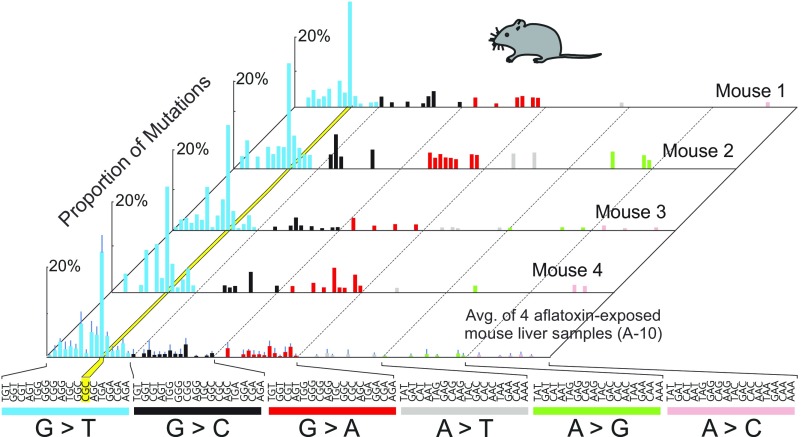
Fig. S3.
Mutational patterns derived from the livers of AFB1-treated mice 10 wk after carcinogen administration. Spectra from four biological replicates are shown to demonstrate the reproducibility of the method. The yellow stripe highlights the G:C→T:A hotspot in the 5′-CGC-3′ context. The underlined G is the position of the mutation. Averaged data are shown in the bottom spectrum, along with error bars denoting SD. Avg., average.

