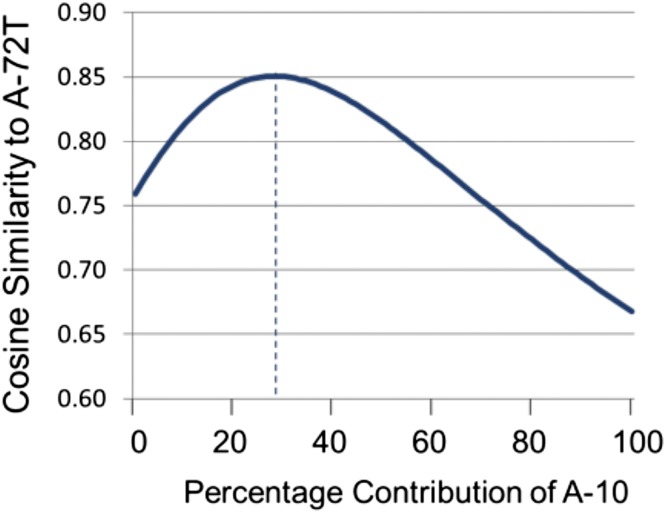
Fig. S5.
Comparison of A-72T with linear combinations of A-10 and D-10 spectra by cosine similarity. Linear combinations of A-10 and D-10 spectra were compared with the tumor spectrum A-72T using cosine similarity. The extreme values reflect the cosine similarity between A-72T and D-10 (0.76) when the A-10 contribution is 0% and between A-72T and A-10 (0.66) when the A-10 contribution is 100%. The linear combination composed of 29% A-10 and 71% D-10 (denoted with the dotted line) gave the maximum cosine similarity with A-72T, which was 0.85.

