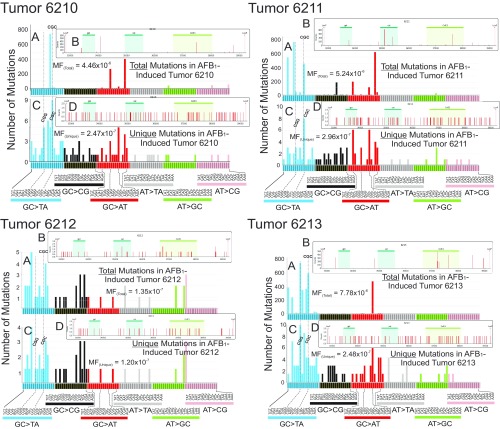
Fig. S6.
Distribution of total number of mutations, and the number of unique mutations, in each of the tumor samples from the AFB1-treated mice at 72 wk. The numbers 6210, 6211, 6212, and 6213 denote individual tumor-bearing mice. Total base substitution mutations were plotted by their three-base contexts (A) as well as by the respective positions and intensities of those mutations within the 6.4-kb transgene analyzed in the λ-gptΔ B6C3F1 mouse (B). The areas in B marked as gpt, cat, and ColE1 represent features of the EG10 fragment and are highlighted only for orientation purposes. The vertical bars in B indicate the position where a mutation was observed; the multiplicity of each mutation is represented by the height of each bar (relative to the scale shown on the y axis). In each case, unique mutations in three-base contexts (C) and across the 6.4-kb transgene (D) are plotted. In three of the four mice (6210, 6211, and 6213), there are mutations with a high clonality, because they occur hundreds of times; mouse tumor 6212 showed less evidence of clonality. All sequenced mutations are included in A and B. As shown in Table 1, up to 95% of the mutations were clonal in origin in the tumor samples; the mutational spectrum in which clonal mutations (mutations that occurred repeatedly at the same nucleotide position in the 6.4-kb target) were counted only once is shown in C and D.

