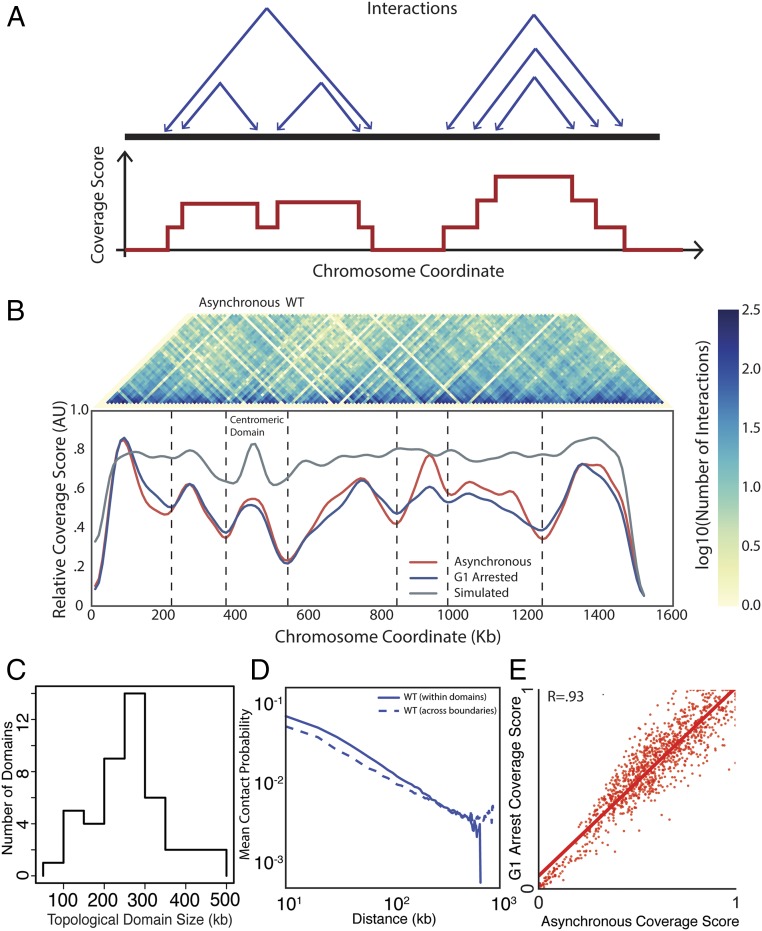
Fig. 1.
Identification of TADs in the yeast genome. (A) Schematic of coverage score, which is the number of intrachromosomal interactions that span a specific locus (Methods). Highly covered loci are expected to be at the center of TADs, whereas poorly covered loci are expected to be in boundary regions between TADs. (Upper) Each set of two arrows points to loci denoting interactions. (Lower) Coverage score corresponding to the six interactions above. (B) Heatmap denoting the frequency of interactions in asynchronous WT Hi-C data between two loci on chromosome IV (Upper) and corresponding coverage score (Lower) for asynchronous (red) and G1-arrested (blue) cells. Vertical lines denote domain boundaries corresponding to minima in the coverage score (Methods). The null model (gray) that only identifies centromeric domains was generated by simulations following ref. 21, combining polymer physics and positional constraints. (C) Distribution of TAD sizes for all chromosomes in G1-arrested cells. (D) Normalized interaction frequency plotted as a function of distance for pairs of loci located within domains (solid) or across domain boundaries (dashed). (E) Correlation of coverage score for all chromosomes for pheromone arrested and asynchronous cells.

