Fig. 2.
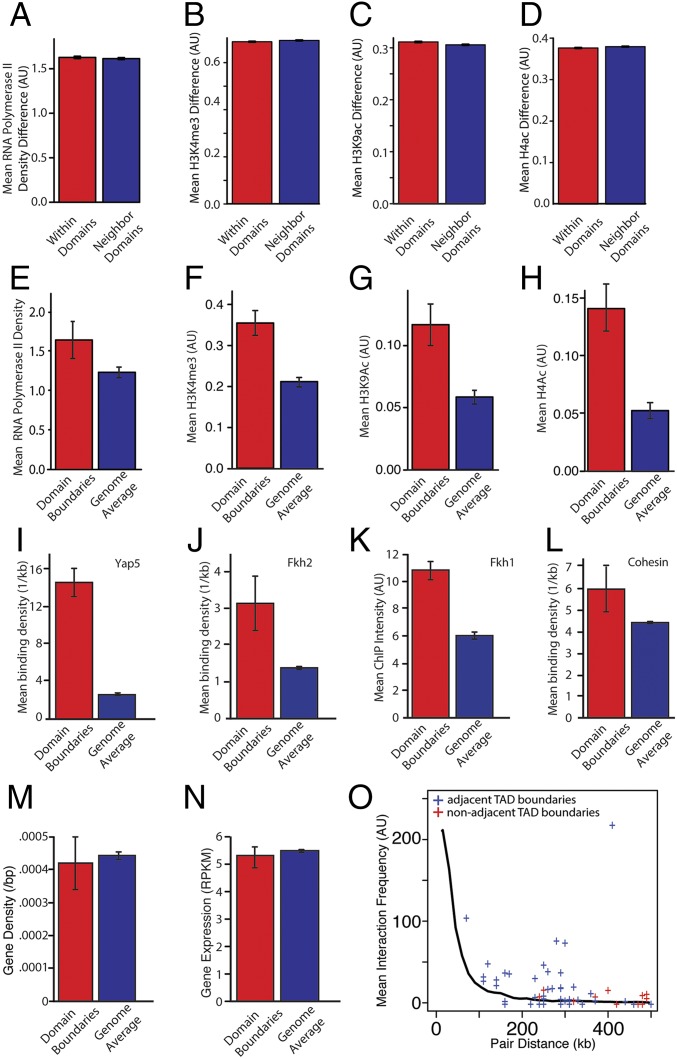
Transcription is enriched in TAD boundaries. (A–D) For each gene we calculate the mean RNA polymerase II density and level of histone modification. We then determine the difference in these values for all gene pairs in two neighboring TADs. For gene pairs within a TAD and for gene pairs spanning a TAD boundary, the differences in polymerase II density and histone modifications are not statistically different (P > 0.05). (E–H) A gene was defined as being within a TAD boundary region if it is within 5 kb of the boundary. Compared with the average for the whole genome, RNA polymerase and associated histone modifications are significantly enriched at TAD boundary regions. (I and J) Binding site density relative to TAD boundaries for Yap5 (I) and Fkh2 (J). ChIP-chip data were used to estimate the mean signal for (K) Fkh1 and (L) cohesin. The transcription factors Fkh2, Yap5, and Fkh1 are enriched at TAD boundaries (P < 0.01 for all comparisons). P values were calculated using Bonferroni correction for multiple hypothesis testing. (M) Gene density at domain boundaries compared overall gene density. (N) Transcript abundance from genes at domain boundaries compared with all other genes. (O) Interaction frequency for TAD boundaries on the same chromosome as a function of their genomic distance apart. Each + indicates intrachromosomal interaction frequency for a pair of boundaries. The solid line denotes the average distance-dependent interaction frequency for all fragments. TAD boundaries interact more frequently with one another than expected given their genomic distance (P < 0.01 compared with datasets having the same number of pairs the same distance apart whose interaction frequency was determined by sampling from the distance-dependent interaction distribution).

