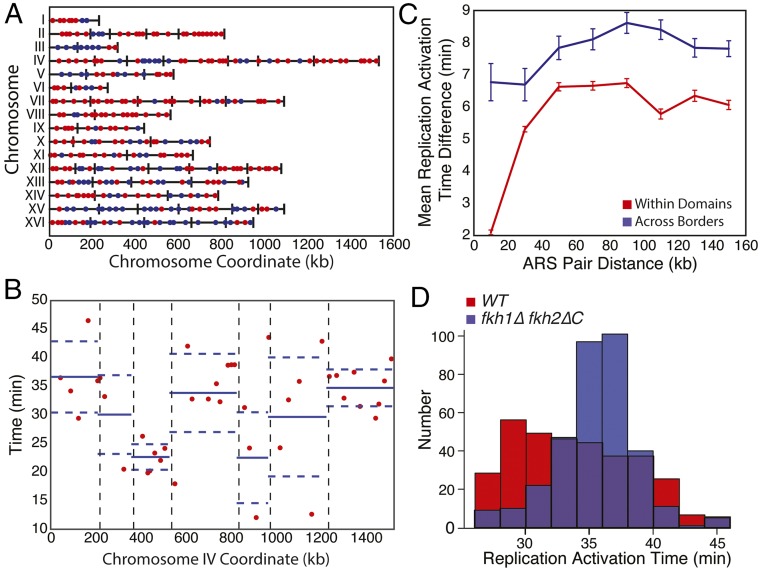
Fig. 4.
Replication origins within TADs synchronously initiate DNA replication. (A) Origins were classified as early (blue) or late (red). Replication timing exhibits spatial correlation. Black lines denote TAD boundaries. (B) TAD boundaries (vertical dashed lines) separate clusters of similarly timed origins on chromosome IV. Each dot denotes the location and activation time of a single origin as determined by Raghuraman et al. (41). For all origins within a TAD, the blue solid and dashed horizontal lines represent the mean activation time and its SE. (C) The difference in replication timing between origins (ARS, autonomously replicating sequences) within TADs is smaller than for origins of similar distance apart in different TADs. (D) fkh1∆ fkh2∆C mutants more synchronously replicate their DNA compared with WT. Data from Knott et al. (25) were analyzed.

