Fig. 5.
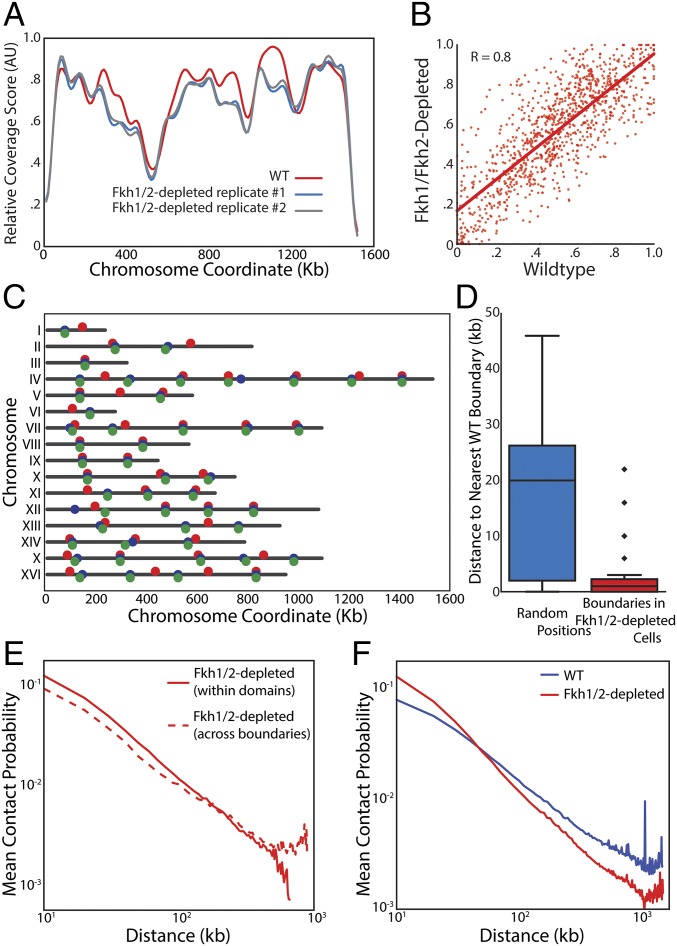
TAD architecture does not depend on Fkh1/2. (A) Coverage score for chromosome IV for one WT and two Fkh1/2-depleted replicates showing no major changes in coverage in the absence of Fkh1/2. (B) Coverage in Fkh1/2-depleted cells is highly correlated with coverage in WT cells. Red line indicates the linear regression. (C) Diagram of chromosomes with boundaries marked as independently identified for WT (red) and Fkh1/2-depleted cells (blue and green denote biological replicates). (D) Comparison of distances from a boundary in Fkh1/2-depleted cells to the nearest boundary in WT cells (Right) compared with the distribution of distances from randomly chosen locations to the closest boundary in WT cells (Left). (E) Normalized interaction frequency plotted as a function of distance for pairs of loci located within a domain (solid) or across domain boundaries (dashed). (F) Normalized interaction frequency plotted as a function of distance for all pairs of loci in WT (blue) and Fkh-depleted (red) cells.

