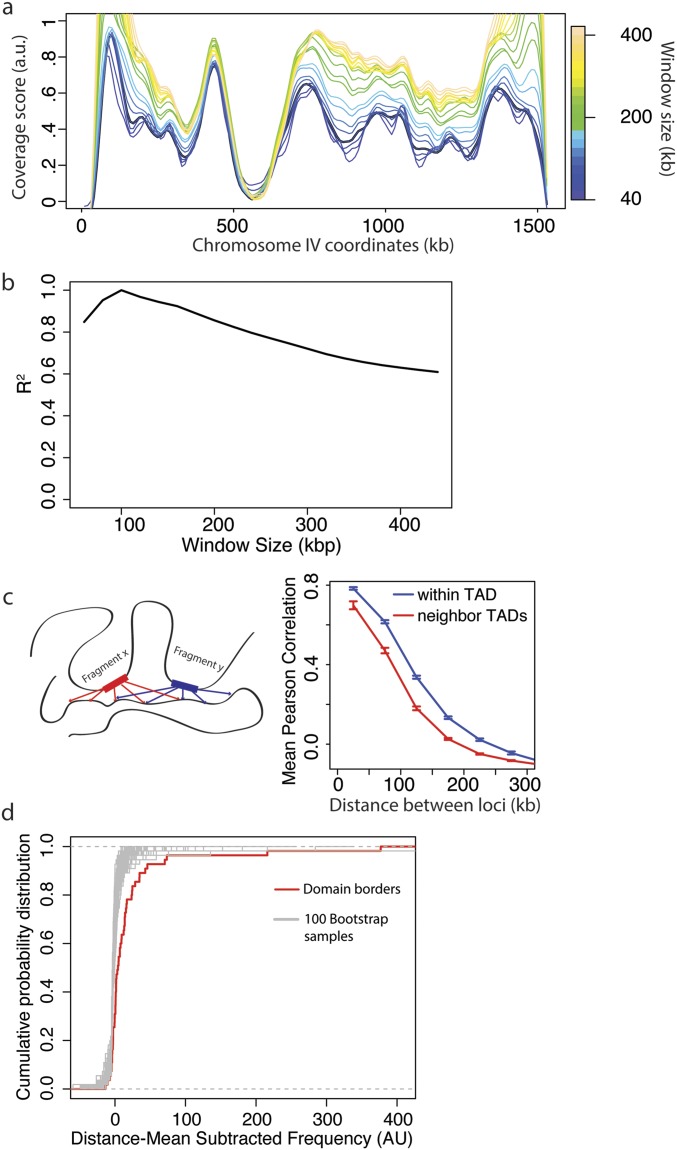
Fig. S2.
Analysis of coverage score parameters and TAD properties. (A) Coverage score for chromosome IV for window sizes between 20 and 200 kb. See Methods for a more detailed description of how the coverage score is calculated. Briefly, for the analysis in the main text, the coverage score for each 10-kb bin was calculated by finding the total number of interactions between fragments in a 100-kb window centered on the bin of interest. Here we show how the coverage score varies when the window size is changed. (B) Correlation R2 between coverage scores calculated for a 100-kb window with coverage scores calculated for window sizes between 40 and 400 kb. (C, Left) Schematic showing how the interactions for two fragments in a TAD are expected to be correlated. (Right) Mean Pearson correlation for all fragments as a function of their distance apart and whether or not they are in the same TAD. (D) Cumulative distribution of mean subtracted domain boundary interaction frequencies compared with randomly selected fragments from the whole genome. For each distance apart, there is a mean frequency of interactions. For each pair of domain boundary fragments, this distance-dependent mean frequency was subtracted from their frequency of interactions. The distribution of boundary fragment interaction frequencies was compared with 100 bootstrap samples, randomly chosen from all of the elements in the genome. The set of domain boundaries was more highly interacting than all other 100 bootstrap samples.

