Fig. S4.
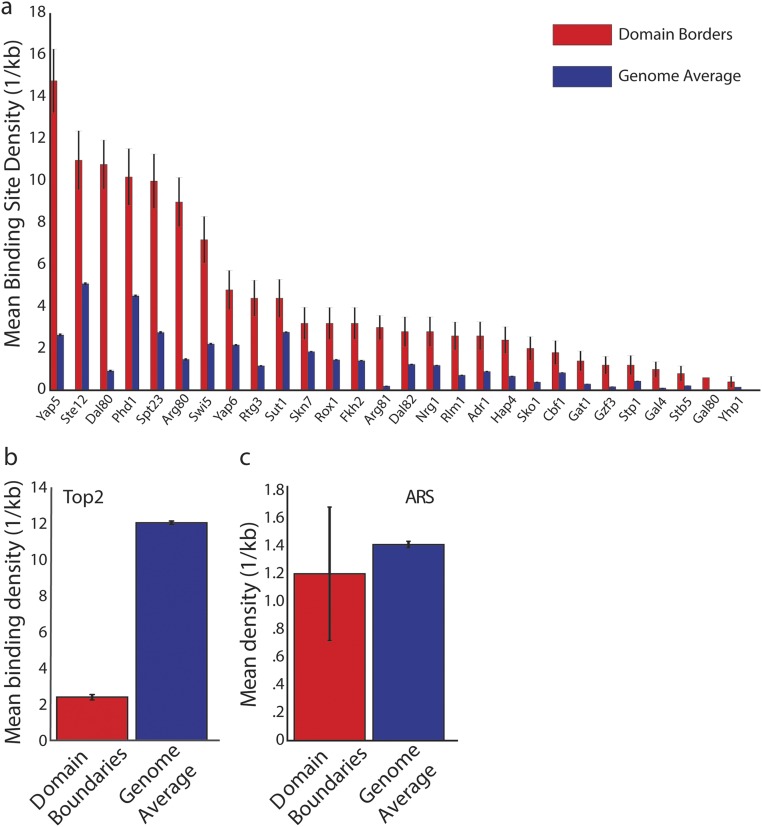
Additional domain boundary analysis. (A) Transcription factors whose binding site densities that were significantly enriched in boundary regions. TAD boundaries were defined as a 10-kb window centered on the minimum of the coverage score. Transcription factor binding density estimates are from MacIsaac et al. (31). (B) Topoisomerase II (Top2) was depleted at TAD boundaries as determined by differences in ChIP-chip signal from Sperling et al. (33). (C) Replication origins are not found more frequently with boundary regions compared with the genome overall.

