Significance
The science and engineering workforce has aged rapidly, both absolutely and relative to the workforce, which is a concern if the large number of older scientists crowds out younger scientists. Moreover, scientists are believed to be most creative earlier in their careers, so the aging of the workforce may slow the pace of scientific progress. We study the causes of this aging, showing that a substantial majority is a result of the aging of the large baby boom cohort of scientists, but the elimination of mandatory retirement in universities in 1994 was also an important factor. Strikingly, current patterns imply a steady-state mean age 2.3 y higher than the 2008 level of 48.6.
Keywords: science of science, demography, aging, retirement, innovation
Abstract
The science and engineering workforce has aged rapidly in recent years, both in absolute terms and relative to the workforce as a whole. This is a potential concern if the large number of older scientists crowds out younger scientists, making it difficult for them to establish independent careers. In addition, scientists are believed to be most creative earlier in their careers, so the aging of the workforce may slow the pace of scientific progress. We develop and simulate a demographic model, which shows that a substantial majority of recent aging is a result of the aging of the large baby boom cohort of scientists. However, changes in behavior have also played a significant role, in particular, a decline in the retirement rate of older scientists, induced in part by the elimination of mandatory retirement in universities in 1994. Furthermore, the age distribution of the scientific workforce is still adjusting. Current retirement rates and other determinants of employment in science imply a steady-state mean age 2.3 y higher than the 2008 level of 48.6.
The US science and engineering workforce is aging rapidly. This is a potential problem for two reasons: (i) older scientists may not retire at a fast enough rate to free up positions for younger researchers to establish independent careers (1–4), and (ii) scientific creativity is thought to peak at a relatively young age (5–9), although the evidence is in fact somewhat mixed. The aging of the scientific workforce has been called a crisis (10). Policy proposals have focused on directing more research support to new and early-stage investigators to maintain the quantity and quality of scientific research and the sustainability of the scientific workforce (11, 12). However, we are not aware of rigorous analyses of the causes of the aging of the scientific workforce, and the implications of current trends for the long-run age distribution of scientists.
This article develops and simulates a demographic model of the scientific workforce to (i) determine the causes of the recent aging trend and (ii) predict the long-run effects of these factors on the age distribution. First, we show that “demographic momentum” in the form of the aging of the large baby boom cohort has driven much of the recent rapid aging of the scientific workforce, and will continue to do so for the next two decades as the later cohorts of the baby boom pass through their 60s and early 70s. However, sharp declines since 1993 in the rate at which scientists retire from employment can account for 8% of the increase in the mean age of scientists. The decline in retirement was most likely triggered by the elimination of mandatory retirement at universities in 1994. We also find that the aging of the workforce as a whole (due to lower fertility) accounts for 13% of the increase in the mean age of the scientific workforce. Second, we show that the scientific workforce was very far from its implied steady-state age distribution when our analysis begins in 1993 (4.9 y younger on average). Strikingly, the scientific workforce remains far from steady state even as of 2008—current entry, exit, and transition rates imply that the mean age of the scientific workforce will increase by another 2.3 y from that level.
The main source of data on US scientists and engineers is the restricted-use 1993–2010 Survey of Doctorate Recipients (SDR) of the National Science Foundation (NSF), a typically biannual longitudinal sample survey of the population with a research doctorate in science, engineering, or health, earned in the United States (https://www.nsf.gov/statistics/srvydoctoratework/). We use detailed information on age, field of degree, job tenure, previous employment, occupation, and sector of employment on about 73,000 scientists aged 76 or less, across all fields (we refer to this population as “scientists,” although we include people with engineering, health, and social science degrees and all sectors of employment). We supplement the SDR with census data from the Current Population Survey (CPS), the 1980 and 1990 US Decennial Censuses, and the 2000–2013 American Community Surveys. The census data provide information on trends in the age distribution of the US workforce as a whole (defined as individuals who work at least 13 wk per y and 15 h per wk), and they also help fill two gaps in coverage of the SDR: scientific workers in the United States who obtained a PhD abroad, and pre-1993 data. Complete details are provided in SI Appendix, section 1. (Consent was obtained from SDR participants by NSF. Our work was approved by Ohio State University and National Bureau of Economic Research’s institutional review boards.)
Descriptive Results
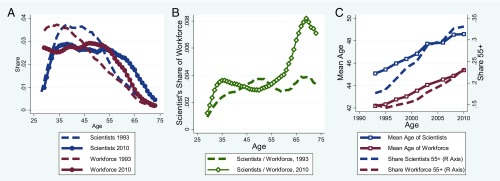
Fig. 1A shows the age distribution of the scientific workforce in 1993 and 2010, the first and last years of SDR data available to us. The aging of the workforce is evident, with a significant decline in the share of scientists aged 35–53 and a significant increase in the share older than 53. The workforce as a whole is also aging, as shown in Fig. 1A. In 1993, the scientific workforce was disproportionately concentrated at ages 30–56 compared with the workforce as a whole, which had substantial mass at younger ages. (The SDR includes only people with PhDs, so our definition of the scientific workforce excludes graduate students. The age distribution estimates for the 20s and early 30s should be interpreted with this in mind.) In 1993, the distributions at ages 57+ were nearly identical. By 2010, the share of scientific workers aged 55+ was much larger than the corresponding share for all workers. Thus, scientists in 2010 were employed at older ages to a much greater extent than the workforce as a whole, in contrast to 1993. Fig. 1B shows the share of scientific workers in the workforce by age (the ratio of scientists to the workforce as a whole from Fig. 1A). In 2010, the share of scientists increases from 0.27% at age 50 to over 0.8% at age 71, in clear contrast to 1993, when the share of scientific workers peaked at 0.4% and there is no strong age pattern. Comparing the scientific workforce to the highly educated workforce as a whole (reported in SI Appendix, Fig. S1) shows that scientists are aging less relative to the more educated workforce than relative to the workforce as a whole.
Fig. 1.
The age distribution of the US scientific workforce and the US workforce as a whole. A shows the age distribution of scientists [calculated from the Survey of Doctorate Recipients (SDR)] and the US workforce [calculated from the Current Population Survey (CPS)] for 1993 and 2010. B shows the share of scientists in the US workforce by age in 1993 and 2010. C plots trends in the mean age of scientists and the US workforce as well as the share of scientists and the US workforce age 55 and over.
Fig. 1C illustrates trends in two summary statistics of the age distribution, the mean age and the share 55 and older. The average age of the scientific workforce increased from 45.1 to 48.6 between 1993 and 2010. The mean age of the workforce as a whole increased at a slightly slower pace, from 42.2 to 45.4. There was a larger divergence in the share aged 55 and above. In 1993, the shares were 0.18 for scientific workers, and 0.15 for all workers. By 2010, the share of all workers aged 55+ increased to 0.23, whereas the share of scientific workers rose to 0.33. Thus, the aging of the scientific workforce has been especially concentrated at older ages and was considerably more rapid than that of the workforce as a whole. SI Appendix, Figs. S2–S4 present age distributions for individual years, and breakdowns by field and different segments of the science workforce. They show that the aging pattern is pervasive across fields—biomedicine, where aging has received considerable attention, is not exceptional; and computer and information science is initially younger than the other fields but ages considerably more rapidly. Not surprisingly, scientists whose primary or secondary activity is research tend to be somewhat younger. Scientists in academia tend to be slightly younger than those outside, but the trends are similar. SI Appendix, Fig. S5 shows that the share of academics has declined slightly from 42% to 38% between 1993 and 2008.
The three main determinants of the age distribution of the scientific workforce, beyond the part that can be explained by aggregate demographic trends, such as declining fertility and mortality rates and the large size of the baby boom cohort, are as follows: (i) the proportion of the population that completes a PhD in a science discipline and the distribution of age at completion; (ii) entry to the US scientific workforce by immigrants, both those who obtain a PhD in the United States and scientists who obtained a PhD abroad (scientists who obtained a PhD abroad are excluded here because they are not covered by the SDR, but included in the analysis of census data below); and (iii) the rate of exit from the scientific workforce. We begin by documenting trends in these factors before turning (in the next section) to a formal model that quantifies their impact.
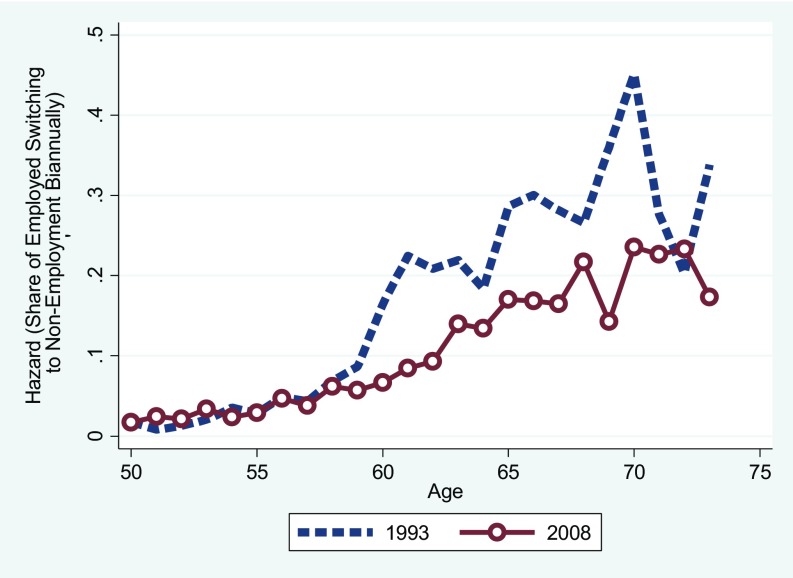
Fig. 2 shows the biannual hazard rate of exit from the scientific workforce to nonemployment in 1993 and 2008. The hazard rate is the probability of exiting the work force conditional on not having previously exited, measured empirically by the proportion of individuals employed as scientists in a particular year who were not employed 2 y later. We refer to it as the hazard rate of retirement, because most exits to nonemployment are in fact self-reported as being due to retirement. (We report biannual hazard rates because the reference periods for the 1993 and 1995 SDR surveys and the 2008 and 2010 surveys were exactly 2 y apart. SI Appendix, section 3 describes how we deal with cases in which the surveys were more than 2 y apart.) In 1993, the shape of the retirement hazard was similar to, but lower than the typical age pattern of retirement (SI Appendix, Fig. S6), with a substantial increase in the exit rate between ages 60 and 62, a jump at age 65, and a very large spike at age 70. The most recent data show a much slower and more gradual increase in the exit hazard rate, and no major spikes. In particular, the large spike at age 70 in 1993 completely disappeared by 2008. This change is consistent with the end of mandatory retirement at age 70 in universities in 1994 (due to eliminating an exemption for universities to the 1986 Age Discrimination Act), which caused a substantial reduction in the rate of retirement of university faculty (13). SI Appendix, Fig. S6 B and C show that the spike in the retirement hazard at age 70 in 1993 is much larger among scientists in academia than among those outside of academia, and the spike declined by a much larger amount in academia after 1993. As demonstrated below, this change in retirement behavior has had a substantial influence on the age distribution of the scientific workforce.
Fig. 2.
Biannual transition rates from science employment to nonemployment, 1993 and 2008. The figure shows the share of science doctorates employed in science in 1993 (dashed blue) and 2008 (red circles), who are not employed as of the next survey.
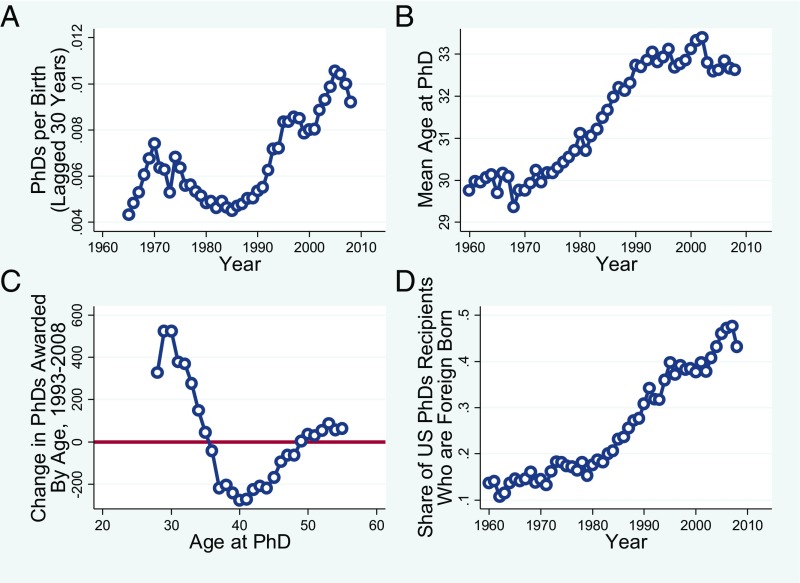
Fig. 3A shows the trend in the scientific PhD completion rate, expressed as a share of births 30 y earlier for illustrative purposes. (These results are not sensitive to using births in a 3-y span on either side of the 30-y base. We are able to extend back to the 1960s by using data on year of PhD completion among scientists up to age 76.) (SI Appendix, section 2 and Figs. S7 and S8 provide additional data on science graduates.) From 1985 to 2008, the rate of science doctorate completion doubled from about 0.005 to 0.010 as a share of lagged births. All other things being equal, this would tend to reduce the age of the scientific workforce. However, as shown in Fig. 3B, the average age at completion of a science PhD in the United States increased from 30 in the 1970s to around 33 in 1993. This clearly contributed to the aging of the scientific workforce in the 1970s, 1980s, and early 1990s, but in the period we study (1993–2008), the mean age at PhD completion actually declined slightly. Fig. 3C focuses on the change over the period we study, from 1993 to 2008, in the number of science PhDs awarded by age. During this period, there was a shift toward PhDs awarded at ages below 36 and away from the late 30s and 40s. Hence, changes in the distribution of age at PhD during this period will not be able to explain aging of the scientific workforce.
Fig. 3.
Trends in US science doctorates. A shows the number of PhDs granted (from the SDR) per birth 30 y earlier (from Vital Statistics of the United States). B displays the mean age at PhD completion calculated from the SDR. C shows the change between 1993 and 2008 in the number of PhDs awarded by age, from the SDR. D reports the share of PhDs awarded in the United States to nonnatives.
The share of foreign recipients among new science doctorates awarded in the United States grew rapidly, from 10% to 15% in the 1960s, to more than 40% in recent years, as illustrated in Fig. 3D. In the absence of foreign PhDs, growth in the number of new science PhDs would likely have been much lower. However, it turns out that this would not have affected the rate of aging of the scientific workforce, because foreign-born and native-born US PhD recipients have very similar employment patterns (see below).
Modeling Changes in the Age Distribution of Scientific Workers
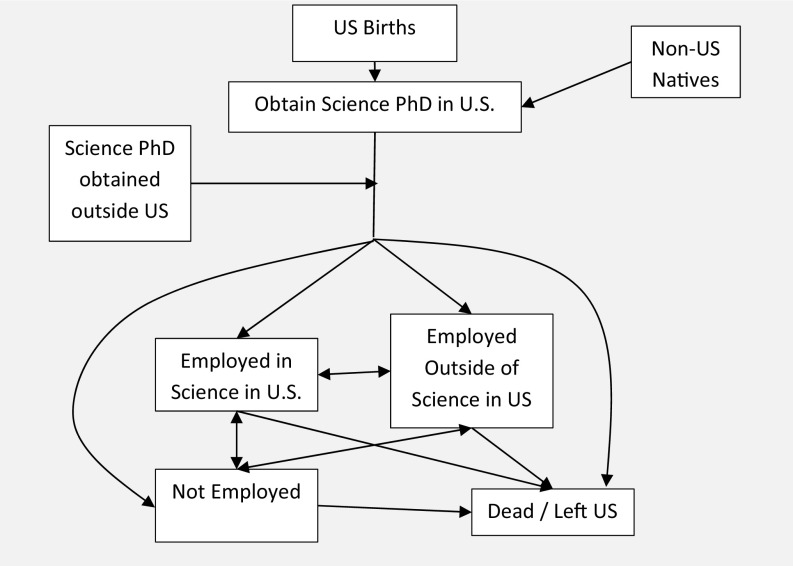
Drawing on standard demographic simulation methods, this section outlines a formal stock-flow model of entry and exit from the scientific workforce by age, which we use to numerically analyze changes in the age distribution of scientists. As illustrated in Fig. 4 and detailed in SI Appendix, section 3, the model allows for entry to the scientific workforce from (i) US natives obtaining a PhD in the United States and (ii) nonnatives obtaining a PhD in the United States (in subsequent analysis described below, we also incorporate entry by nonnatives obtaining PhDs abroad). Doctorate recipients then flow between being employed in the United States in science, being employed in the United States outside of science, and being out of the labor force. SI Appendix, sections 4 and 5 discuss the entry and exit rates symbolized by the arrows in Fig. 4, and SI Appendix, Figs. S9–S11 illustrate their trends.
Fig. 4.
Model schematic. The figure illustrates the model in SI Appendix, section 3, with boxes showing states and arrows showing transitions. Note that the SDR does not include people who leave the United States immediately after completing the PhD, even if they later return to the United States.
We use the model to analyze the change in the age distribution of scientists between 1993 and 2008. (We stop in 2008 because the 2010 SDR does not contain data on all PhDs awarded in 2009.) Simulating the model generates a predicted 2008 age distribution conditional on the observed 1993 age distribution as a function of (i) the observed set of survey-year-and-age–specific hazard rates for employment transitions, (ii) the observed year-and-age–specific PhD completion rate, (iii) observed fertility and mortality rates by year, and (iv) the observed year-and-age–specific share of foreign-born US PhD recipients. We use the model to explore explanations for the aging of the scientific workforce by conducting counterfactual simulations of the 2008 age distribution in which each transition rate is set to its 1993 age-specific value, one at a time and in combination. The only exception is that we use the 1960 birth rate as the counterfactual, because the birth rate affects the workforce with a long lag—scientists aged 27–75 in 1993 were born from 1918 to 1966. We use 1960 as a representative high-fertility year that was part of the baby boom.
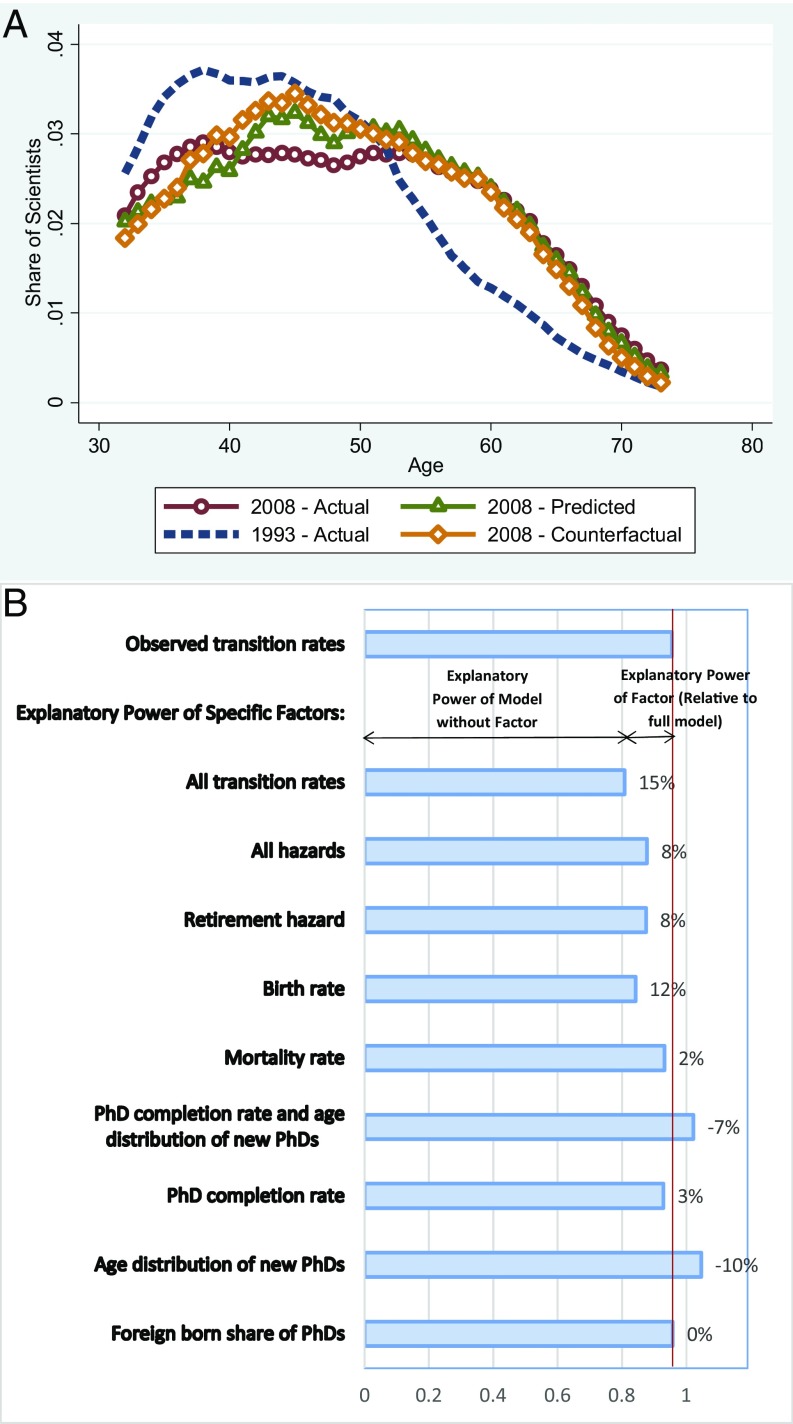
Fig. 5A shows the observed age distributions in 1993 (dashed blue) and 2008 (red circles), the 2008 distribution predicted by the model based on the observed hazard, PhD completion, and birth and death rates for each year (green triangles), and the counterfactual predicted 2008 distribution, using the same model, but holding all transition rates fixed at their 1993 values (yellow diamonds). (SI Appendix, Fig. S12 shows analogous results for the share of scientists in the workforce by age.) As shown above, there was a substantial change in the age distribution from 1993 (dashed blue) to 2008 (red circles). The model slightly overpredicts the decline in the shares until the early 40s, underpredicts the decline in the 40s and 50s, and is quite accurate at later ages. Holding all transition rates fixed at their 1993 values, the model predicts smaller changes at all but the very youngest ages (yellow diamonds) compared with the predicted change, but the differences are very small at ages 48–63. Small random measurement errors in the hazard and other transition rates can cumulate over a 15-y period, because the model is nonlinear. Under the circumstances, the model is remarkably accurate.
Fig. 5.
Changes in the age distribution of the science workforce and explanations. A shows the actual age distributions in 1993 (dashed blue) and 2008 (red circles), the predicted 2008 distribution derived from the model in SI Appendix, section 3 using the observed hazard, PhD completion, and birth and death rates for each year (green triangles), and the counterfactual predicted 2008 distribution, using the same model but holding all transition rates fixed at their 1993 values (yellow diamonds). To facilitate interpretation, we show 5-y moving averages by age. The first row of B shows that, on average, 95% of the age-specific changes in the distribution can be accounted for by changes in observed transition rates. The remaining rows quantify the importance of each factor by using the observed 2008 rates except for the one indicated, for which the 1993 rate is used. For example, holding the retirement hazard constant at its 1993 age-specific level reduces the fraction explained from 0.95 to 0.87, for a loss of 0.08 in the fraction explained, or 8% as a share of the 0.95 explained by the model.
To summarize the results, we compute the fraction of the observed change at each age that can be accounted for by the model [(predicted 2008 – observed 1993)/(observed 2008 – observed 1993)] and report the median of these age-specific changes. We also report in SI Appendix, Table S1 the fraction of the observed change in mean age and the share aged 55 and older that can be explained by the model. Fig. 5B and SI Appendix, Table S1 show that the median age-specific share of the change explained by the model is 95.5%. SI Appendix, Table S1 shows that the model explains 97.3% of the change in the share ages 55 and above, and overexplains the change in the mean age: 120.3%. The next row of Fig. 5B shows that with all transition rates held fixed at their 1993 values, the explanatory power of the model is about 15 percentage points lower for the median of the age-specific shares (and 10–14 percentage points lower for the mean age and share aged 55 and above; SI Appendix, Table S1). Thus, the changes in transition rates over time can account for a relatively small but not negligible part of the predicted change in the age distribution.
The remaining rows of Fig. 5B, in which one rate at a time is held constant, indicate that the change in the hazard rate of retirement is the most powerful explanatory factor (aside from change in the birth rate, which has a population-wide effect, not specific to scientists). If all transition rates had evolved as observed except for the retirement hazard rate, and it had remained constant at the 1993 level, the model could account for 87.5% of the observed change in the median age-specific fraction explained, instead of 95.5%. So the sharp decline in the retirement hazard alone can explain 8.4% of the predicted change in the age structure: [(0.955 − 0.875)/0.955 = 8.4%]. The decline in the birth rate is also important because it reduces the growth rate of the scientific workforce: it can explain 12% of the predicted change. Declining mortality had relatively little impact on the age distribution because mortality has little impact on the age structure at low levels of fertility (14). The decline in the age at PhD completion since 1993 was in the wrong direction to explain aging of the scientific workforce. The slight decline in the rate of production of science PhDs since 1993 had little impact on the age distribution. The other hazard rates account for only small changes in the age distribution of scientists. Strikingly, the large increase in the share of US science PhDs awarded to foreign-born individuals has had virtually no impact on the age distribution because foreign-born and native science PhD recipients behave very similarly (i.e., have very similar hazard rates; see ref. 15 for analysis of foreign-born US-trained scientists). SI Appendix, section 6 and Figs. S13–S17 show the large increase in women among science and engineering graduates and extend the model to allow differences in transition rates by gender and by nativity. As detailed in SI Appendix, section 6, these extensions had virtually no impact on the results.
The Long-Run Age Distribution of the Scientific Workforce
We use the model to investigate the implications of current transition rates for the long-run age distribution of the scientific workforce. This is important because the age distribution can take many years to reach the steady state implied by a given set of transition rates. Thus, the current age distribution may not be a good indicator of the future. We also show how the steady-state age distribution is affected by alternative values of the transition rates.
In this part of the analysis, we are able to extend the model to incorporate immigration of scientists who received a science PhD abroad (or received a US PhD, left the United States, and then returned), which is not measured in the SDR, using data from the American Community Survey (ACS). We combine data from the ACS for the years 2000–2013 to compute the average annual number of recently arrived immigrant scientists. Our methods and results are presented in SI Appendix, section 7 and Figs. S18–S20. SI Appendix, Fig. S18 shows the rapid growth in the share of immigrants in the US scientific workforce, especially at ages 45–54 (SI Appendix, Fig. S19). SI Appendix, Fig. S20 shows that the number of recent arrivals (less than or equal to 1 y in the United States at the time of the survey) drops sharply from 1,500 at age 31 to 500 at age 40 and 250 by age 50. Summing over ages, the total number of scientists trained abroad immigrating to the United States has been around 17,000 per year on average since 2000. This compares to about 35,000 new science doctorates produced in the United States per year, including those earned by nonnatives who remain in the United States (SI Appendix, Fig. S8). (We have no data on the transition rates of foreign-trained scientists, so we assume they have the same rates as those of US-trained scientists.)
We simulate the steady-state distribution by letting the model run with the 1993 transition rates until the age distribution converges. Strikingly, the steady-state mean age implied by the 1993 transition rates is 4.9 y greater than the observed age in 1993, indicating that one reason for the aging from 1993 to 2008 was that the 1993 age distribution was very far from the steady state.
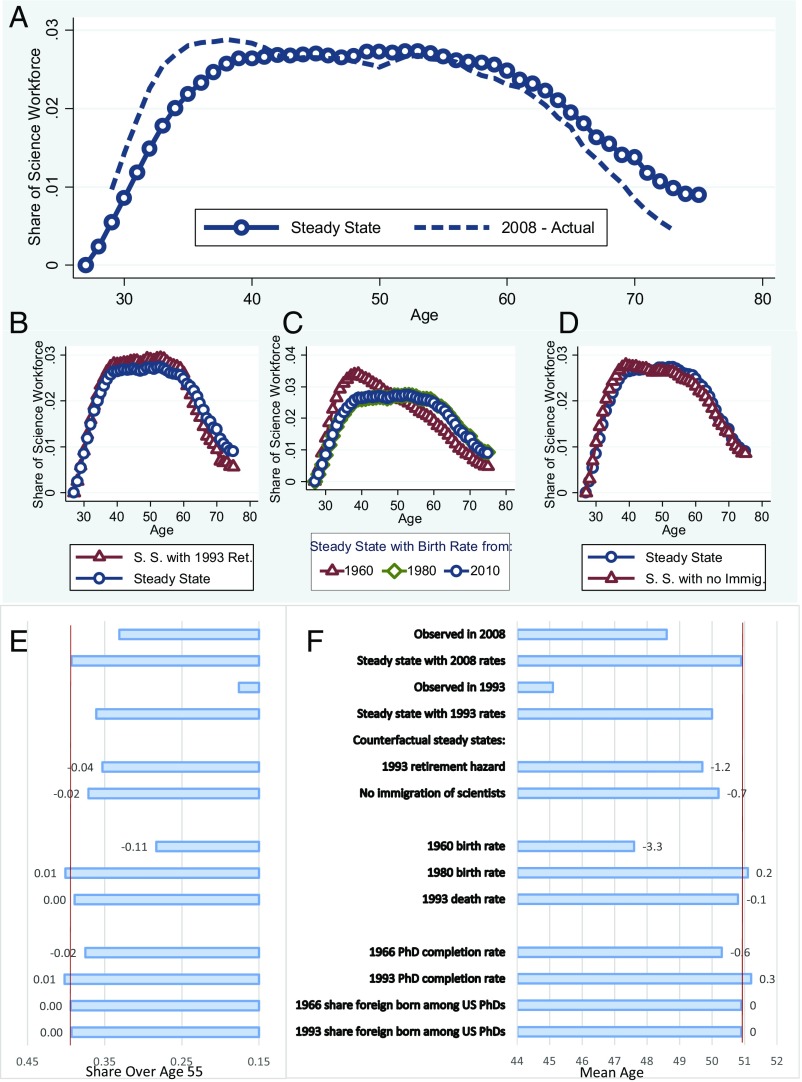
Fig. 6A reveals that the 2008 transition rates imply a substantially older scientific workforce than that observed. Summary statistics in the top part of Fig. 6 E and F, the top part of SI Appendix, Table S2, and SI Appendix, Fig. S21 indicate that, if 2008 transition rates persist, in the long run the mean age of the scientific workforce will increase by 2.3 y, from 48.6 in 2008 to 50.9 (Fig. 6F), and the fraction aged 55 and older will increase by 6.2 percentage points, from 0.331 to 0.393 (Fig. 6E). Thus, despite the already rapid aging of the scientific workforce from 1993 to 2008 (compare the first and third rows), the 2008 transition rates imply a substantially older age distribution. The transition takes about 40 y.
Fig. 6.
Age distribution of science workforce: Actual, steady state, and counterfactuals. A shows the actual 2008 age distribution (from the SDR, dashed) and implied steady state (circles). B shows the steady state from A (blue circles) and the counterfactual steady state assuming the 1993 retirement hazard rates (red triangles). C shows the steady state from A (blue circles) and the counterfactual assuming the 1960 birth rate (red triangles) and 1980 birth rate (green diamonds, just behind the blue circles). D shows the steady state from A (blue circles) and the counterfactual steady state assuming no immigration of science workers (red triangles). The top four rows of E and F provide basic descriptive statistics on the share of the science workforce over age 55 (E) and the mean age (F). The remainder of E and F report the effect on the implied steady state of the change illustrated. The row labeled “1993 retirement hazard” uses observed 2008 transition rates except for the retirement hazard, which is set to its 1993 level. The other counterfactuals have a similar interpretation. The 2008 transition rates are based on 1-y transitions observed between the 2008 and 2010 survey waves. The 1993 transition rates are based on 1-y transitions observed between the 1993 and 1995 survey waves.
We resimulate the model to examine how alternative values of the transition rates affect the steady-state age distribution. Fig. 6 E and F, and SI Appendix, Table S2 and Fig. S22 indicate that changing the retirement hazard from the 2008 level to the 1993 level would imply a mean age of the steady-state age distribution of 49.7, 1.2 y lower than the 50.9 y implied by the 2008 hazard (Fig. 6E) and a 0.040 smaller share of the science workforce over age 55. Fig. 6 B–D illustrates the implied steady-state distribution (red triangles for a variety of counterfactuals). Fig. 6 E and F and SI Appendix, Table S2 show that the total fertility rate of 3.76 in 1960, compared with 1.85 in 1980 and 1.93 in 2010, would imply a mean steady-state age of 47.6 y and a share of scientists over 55 of 0.283, both of which are lower than the observed 2008 levels.
We simulate the impact of immigration of scientists who obtained a PhD abroad by comparing a hypothetical scenario of zero immigration with the observed immigration level shown in SI Appendix, Fig. S20. Fig. 6 and SI Appendix, Table S2 and Fig. S23 show that, in the absence of any immigration, the steady-state mean age would be 50.2, 0.7 y younger than in the steady state implied by current immigration, and the share age 55 and above would be 0.371, or 0.022 lower. This rather surprising finding is a consequence of the older average age of entry to the scientific workforce by scientists trained outside the United States compared with US-trained scientists.
The other rows of Fig. 6 E and F and SI Appendix, Table S2 indicate that changes in mortality, the PhD completion rate, and the share of foreign-born PhDs will have little impact on the steady-state age distribution of the scientific workforce.
Conclusions
Our major findings are that (i) the scientific workforce has aged rapidly in recent years relative to the workforce as a whole; (ii) the main causes have been a decline in the retirement rate of older scientists, which occurred after the elimination of mandatory retirement in universities, and a convergence to the steady-state distribution as the baby boom cohort has aged; and (iii) current trends imply a further substantial increase in the age of the scientific workforce in coming years. Although we have taken entry and transition rates as given, if instead one assumes that the size of the scientific workforce is largely fixed, then these factors may further crowd out young scientists. However, this “lump of labor” hypothesis has been tested and rejected in many contexts (16). The implications of these findings depend on whether and how rapidly scientific productivity declines with age, and whether the life cycle pattern of scientific productivity will change in response to the aging of the scientific workforce. If scientific productivity is much lower at older ages, and if this is mainly due to inherent physiological factors, then the aging of the scientific workforce will have an adverse impact on scientific productivity in the United States.
We acknowledge limitations in our study resulting from the fact that scientists without a US science doctorate, including physician scientists who do not have a PhD, and scientists trained abroad are excluded. We also acknowledge that our simulation model is mechanical and does not account for possible behavioral responses to the changing age distribution of the scientific workforce in domains such as whether to obtain a science doctorate, whether to become part of the scientific workforce, and whether to focus on research.
Supplementary Material
Acknowledgments
We thank Wei Cheng and Wei Yang Tham for outstanding research work; seminar participants at the Institute of Labor Economics (IZA) and the Berlin Applied Micro Seminar for helpful comments; John Ham, Donna Ginther, participants at the Innovation in an Aging Society Meetings, for comments; and the NIH Advisory Committee to the Director Biomedical Research Workforce Working Group for inspiration. We both gratefully acknowledge the support from the NIH (National Institute on Aging, Office of Behavioral and Social Sciences Research, and NSF’s Science of Science and Innovation Policy Program via Grant P01 AG039347). B.A.W. also thanks the NSF (Grants 1064220, 1348691, and 1535399) and the Kauffman and Sloan Foundations. Any opinions, findings, and conclusions or recommendations in this material are those of the authors and do not necessarily reflect the views of our funders.
Footnotes
Conflict of interest statement: The authors declare B.A.W. was supported under P01 AG039347 directly by the National Bureau of Economic Research and on a subcontract to Ohio State University.
This article is a PNAS Direct Submission.
Data deposition: The data are restricted use data from the Survey of Doctorate Recipients, which are available from the National Science Foundation subject to their application process. We will make our code available upon request.
This article contains supporting information online at www.pnas.org/lookup/suppl/doi:10.1073/pnas.1611748114/-/DCSupplemental.
References
- 1.Teitelbaum MS. Research funding. Structural disequilibria in biomedical research. Science. 2008;321(5889):644–645. doi: 10.1126/science.1160272. [DOI] [PubMed] [Google Scholar]
- 2.Teitelbaum MS. Falling Behind: Boom, Bust, and the Global Race for Scientific Talent. Princeton Univ Press; Princeton: 2014. [Google Scholar]
- 3.Alberts B, Kirschner MW, Tilghman S, Varmus H. Rescuing US biomedical research from its systemic flaws. Proc Natl Acad Sci USA. 2014;111(16):5773–5777. doi: 10.1073/pnas.1404402111. [DOI] [PMC free article] [PubMed] [Google Scholar]
- 4.Heggeness ML, Carter-Johnson F, Schaffer WT, Rockey SJ. Policy implications of aging in the NIH-funded workforce. Cell Stem Cell. 2016;19(1):15–18. doi: 10.1016/j.stem.2016.06.012. [DOI] [PubMed] [Google Scholar]
- 5.Lehman HC. Age and Achievement. Princeton Univ Press; Princeton: 1953. [Google Scholar]
- 6.Simonton DK. Scientific Genius: A Psychology of Science. Cambridge Univ Press; Cambridge, UK: 1990. [Google Scholar]
- 7.Levin SG, Stephan PE. Research productivity over the life cycle: Evidence for academic scientists. Am Econ Rev. 1991;81(1):114–132. [Google Scholar]
- 8.Jones BF. The burden of knowledge and the “death of the renaissance man”: Is innovation getting harder? Rev Econ Stud. 2009;76(October):283–317. [Google Scholar]
- 9.Jones BF, Weinberg BA. Age dynamics in scientific creativity. Proc Natl Acad Sci USA. 2011;108(47):18910–18914. doi: 10.1073/pnas.1102895108. [DOI] [PMC free article] [PubMed] [Google Scholar]
- 10.Kaiser J. The graying of NIH research. Science. 2008;322(5903):848–849. doi: 10.1126/science.322.5903.848. [DOI] [PubMed] [Google Scholar]
- 11.National Institutes of Health 2016 New and Early Stage Investigator Policies. Available at https://grants.nih.gov/policy/new_investigators/index.htm. Accessed January 21, 2017.
- 12.White JC, Rush M, Schaffer WT. Workforce Modeling for the National Institutes of Health (NIH) National Institutes of Health; Bethesda, MD: 2009. [Google Scholar]
- 13.Ashenfelter O, Card D. Did the elimination of mandatory retirement affect faculty retirement? Am Econ Rev. 2002;92(4):957–980. [Google Scholar]
- 14.Lee RD. The formal demography of population, aging, and the economic life cycle. In: Martin LG, Preston SH, editors. Demography of Aging. National Academy Press; Washington, DC: 1994. pp. 8–49. [Google Scholar]
- 15.Grogger J, Hanson GH. Attracting talent: Location choices of foreign-born PhDs in the United States. J Labor Econ. 2015;33(3, Part 2):S5–S38. [Google Scholar]
- 16.Gruber J, Wise DA. 2010. Social Security and Retirement Programs Around the World: The Relationship to Youth Unemployment (Univ of Chicago Press, Chicago)
Associated Data
This section collects any data citations, data availability statements, or supplementary materials included in this article.


