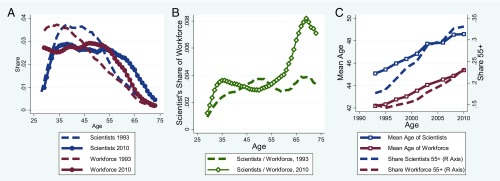
Fig. 1.
The age distribution of the US scientific workforce and the US workforce as a whole. A shows the age distribution of scientists [calculated from the Survey of Doctorate Recipients (SDR)] and the US workforce [calculated from the Current Population Survey (CPS)] for 1993 and 2010. B shows the share of scientists in the US workforce by age in 1993 and 2010. C plots trends in the mean age of scientists and the US workforce as well as the share of scientists and the US workforce age 55 and over.

