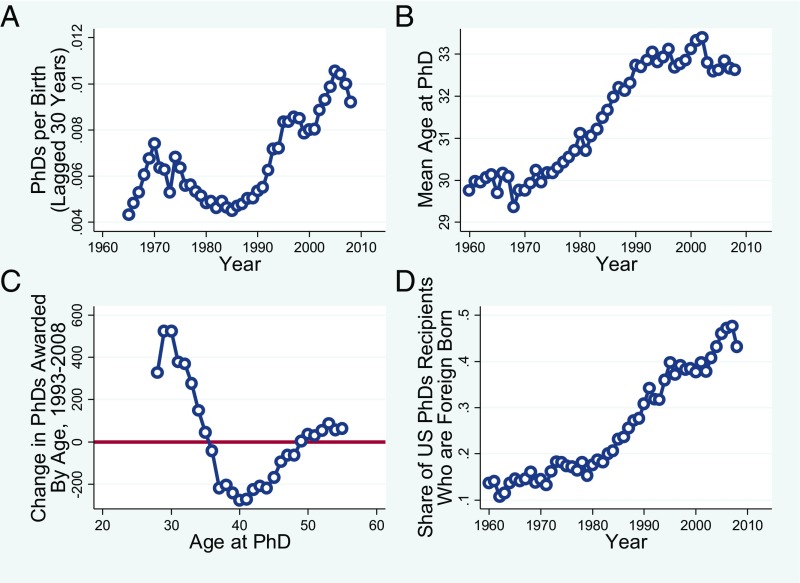
Fig. 3.
Trends in US science doctorates. A shows the number of PhDs granted (from the SDR) per birth 30 y earlier (from Vital Statistics of the United States). B displays the mean age at PhD completion calculated from the SDR. C shows the change between 1993 and 2008 in the number of PhDs awarded by age, from the SDR. D reports the share of PhDs awarded in the United States to nonnatives.

