Significance
The precision of localization-based superresolution microscopy techniques fundamentally relies on the point-spread function of the optical system and the number of photons one can collect. Here, we report that by using a high-numerical-aperture objective lens and a custom cryogenic stage, we are able to increase photon yield by 2–3-fold over room temperature, thereby achieving more precise superresolution reconstructions of complex subcellular structures.
Keywords: superresolution, single molecule, localization microscopy, photoactivated localization microscopy, cryogenic microscopy
Abstract
Superresolution microscopy has fundamentally altered our ability to resolve subcellular proteins, but improving on these techniques to study dense structures composed of single-molecule-sized elements has been a challenge. One possible approach to enhance superresolution precision is to use cryogenic fluorescent imaging, reported to reduce fluorescent protein bleaching rates, thereby increasing the precision of superresolution imaging. Here, we describe an approach to cryogenic photoactivated localization microscopy (cPALM) that permits the use of a room-temperature high-numerical-aperture objective lens to image frozen samples in their native state. We find that cPALM increases photon yields and show that this approach can be used to enhance the effective resolution of two photoactivatable/switchable fluorophore-labeled structures in the same frozen sample. This higher resolution, two-color extension of the cPALM technique will expand the accessibility of this approach to a range of laboratories interested in more precise reconstructions of complex subcellular targets.
Single-molecule localization-based microscopy (SMLM) techniques have enhanced our ability to resolve the intricate spatial relationships between identified subcellular proteins (1–3). These techniques routinely achieve an average localization precision of ∼25 nm (4). Recent SMLM studies have begun to fundamentally alter our understanding of cytoarchitecture (5) and the dynamic interplay of cellular proteins (6, 7).
Despite this progress, many subcellular structures remain difficult to study because they are composed of a compact network of single-molecule-sized elements. These structures lie beyond current SMLM approaches because the accuracy of SMLM techniques is dependent on the achieved precision in localizing individual fluorophores, which primarily relies on the number of photons collected from each of these molecules (8). Unfortunately, genetically encoded probes visualized at room temperature suffer from relatively low quantal yield and high numbers of unactivatable fluorophores, which limit localization precision and the completeness of SMLM reconstructions (9), respectively. Equally lacking are localization methods based on antibody labeling because antibodies necessarily add ∼10 nm of uncertainty in localizing the molecules of interest (10).
To study in detail the native structural relationships of small, densely packed proteins, it would be ideal if one could (i) study frozen, hydrated specimens preserved in their native state, (ii) increase the localization precision of individual molecules to resolve the intricate relationships of small, dense structures and more faithfully reconstruct these objects, and (iii) combine these localization maps of identified objects with the ultrastructural information gained via cryogenic electron microscopy (cryoEM). Examples of the combined use of a cryogenic SMLM method, cryogenic photoactivated localization microscopy (cPALM), and cryoEM have illustrated the utility of combining these methods. However, these studies used cryogenic stages with air-coupled objective lenses that consequently limited the collection of photons and the effective resolution (11–13). Here we developed a cryogenic stage and objective interface that extends the cPALM approach by using a commercially available high-numerical-aperture (N.A.) lens (≥1.2 N.A.), enabling more precise fluorescent imaging of frozen (−140 to −150 °C) hydrated specimens and offering significant improvement over room-temperature imaging with identical equipment. Unlike the only other high-N.A. implementation of cPALM in which the objective is held at temperatures below −135 °C (14), we developed an approach that keeps the objective at ambient temperature and therefore can be used on a conventional microscope. Moreover, we find that like photoactivatable GFP [PaGFP (11)], the photoswitchable protein PSmOrange (15) is able to switch at cryogenic temperatures, adding to the repertoire of photoswitchable proteins capable of switching at cryogenic temperatures (13), and enabling simultaneous localization and comparison of two photoactivatable/switchable proteins within the same sample under cryogenic conditions. These samples can then be imaged using cryoEM to correlate SMLM localization “maps” of identified molecules with ultrastructural information (11, 12).
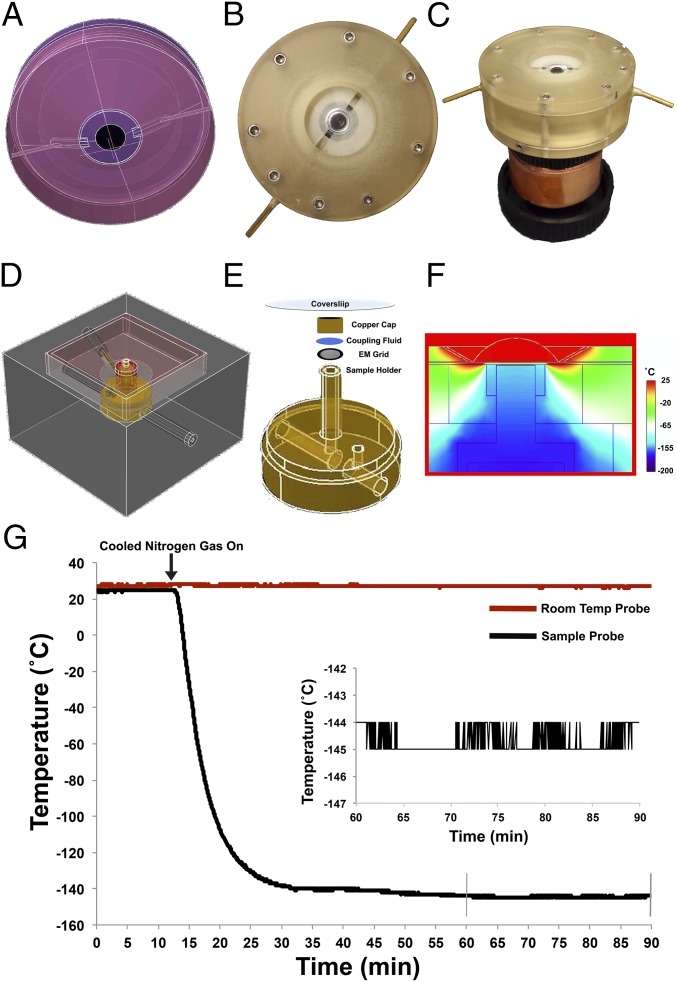
To image frozen hydrated samples with a short working distance high-N.A. lens at temperatures below the threshold for ice crystal formation (≤−135 °C), we built a cryogenic stage that is cooled by the flow of cold nitrogen gas and that maintains samples on electron microscopy grids at stable cryogenic temperatures (Fig. 1 D and E). Samples were optically coupled to the coverslip by a cryofluid that freezes below −150 °C and does not boil at ambient temperature (Fig. 1E). To prevent the immersion fluid between the coverslip and objective from freezing, we developed an objective lens collar that runs room-temperature (RT) immersion fluid past the end of a commercially available water-immersion objective lens (Fig. 1 A–C). In this configuration, a temperature drop of ∼150 °C occurs over a distance of a few hundred micrometers, allowing cryogenic samples to be kept below temperatures for ice crystal formation while the objective lens is maintained at a safe operating temperature (∼15–18 °C) (Fig. 1F and Table S1). The cold stage achieves stable cryogenic temperatures within 15–20 min and can maintain a desired sample temperature during imaging within ±1 °C indefinitely, given a steady supply of cooled gas (Fig. 1G).
Fig. 1.
Cryogenic cold stage for single-molecule localization microscopy. (A) CAD drawing and (B and C) images of high-N.A. objective lens fitted with a collar to run immersion fluid across the lens to prevent lens freezing. (D) CAD drawing of cryogenic cold stage, displaying inlet and outlet ports that run cooled nitrogen gas to a 3-mm sample holder and upward toward objective lens (Movies S1 and S2). (E) Higher magnification view of stage sample holder showing orientation of sample to cryofluid and coverslip. (F) Simulation of thermodynamics when running immersion fluid past the objective lens that is optically coupled via a cryogenic liquid to a sample cooled to −145 °C. (G) Raw temperature data read from a thermocouple embedded in the copper rod directly under the sample, and another placed at RT. Data are from a representative cold run on a sample of HEK 293 cells. After cooled nitrogen gas is turned on (arrow), the copper sample holder cools down to steady state (−143 to −145 °C) within 20 min and can maintain that temperature as long as a supply of liquid nitrogen is available. (Inset) Temperature readout from 45–75 min after the stage began cooling, showing that temperature is stable at steady state to within ±1 °C.
Table S1.
General equation of heat flow in the case of flat layers of material
| Substance | T0, °C | ∆xi, mm | ki, Watts/(M*degK) |
| Water | 20 | Not applicable | Not applicable |
| Glass coverslip | To be determined | 0.17 | 1.0 |
| Cryofluid | To be determined | 0.5 | 0.1 |
| Sample | To be determined | 0.15 | 1.4 |
| Copper support | −153 | Not applicable | Not applicable |
, where ∆Ti is the temperature drop across the ith layer, ∆T is the total drop in temperature, ∆xi is the thickness of the ith layer, and ki is the conductivity of the ith layer. If we put design values into this equation, we can calculate the expected temperature drop. Here, we list the calculated temperatures (in degrees Celsius) at the interfaces. The temperature drops between interfaces are assumed linear: water–coverslip interface, 20 °C; coverslip–cryofluid interface, 14 °C; cryofluid–sample interface, -149 °C; and sample–copper interface, -153 °C. Thus, the physics says that a cold stage with a water immersion lens at near-ambient temperature is possible.
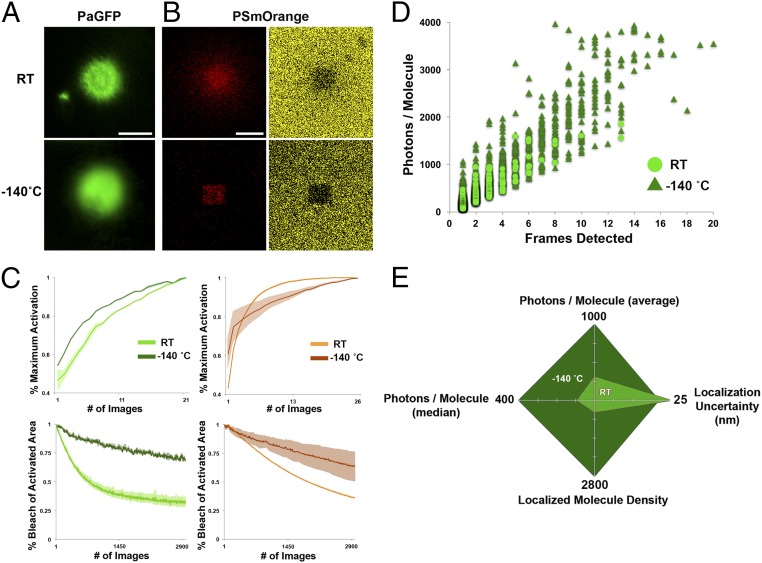
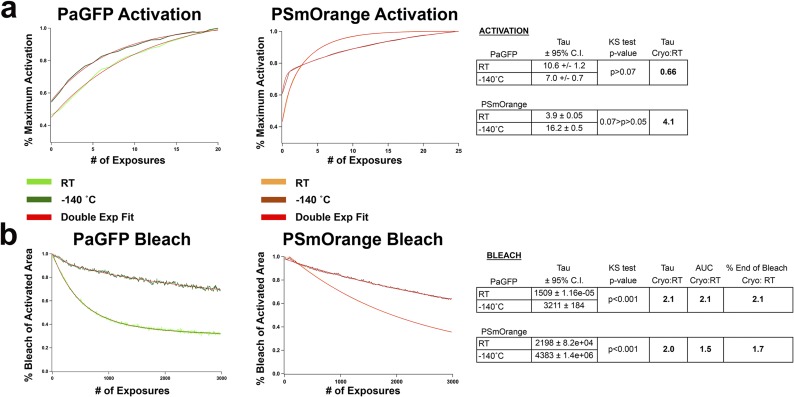
One of the reported benefits of cryogenic fluorescent imaging is the relative reduction in fluorophore bleaching, theoretically increasing photon yield and thus localization precision per fluorescent molecule (14, 16). To quantify this potential increase in photon yield, we first characterized the activation and bleach kinetics of known [PaGFP (11)] and untested [PSmOrange (15)] cryogenic photoactivatable/photoswitchable purified proteins at RT (21–26 °C) and cryogenic temperature (−140 °C) (Fig. 2 A and B). Whereas the rate of PaGFP activation at −140 °C was comparable to that at RT [P > 0.05, Kolmogorov–Smirnov (KS) test], PSmOrange showed a trend toward activating more slowly, taking longer to reach asymptote at −140 °C versus RT (P < 0.07, KS test; Fig. 2C). However, both PaGFP and PSmOrange had significantly reduced rates of bleaching and significantly more captured photons at −140 °C versus RT (∼2.1-fold increase for PaGFP and 1.5–2-fold for PSmOrange; P < 0.001 for both conditions, KS test, n ≥ 3 per condition; Fig. 2C and Fig. S1).
Fig. 2.
Bleach protection, increased single-molecule photon yield, and reduced localization uncertainty of purified protein imaged at cryogenic temperatures. (A) Images of purified PaGFP protein (10 µM; wide-field microscope with commercial cryogenic stage) after activation at RT (Top) and at −140 °C (Bottom). Note the slight increase in background signal at cryogenic temperatures. (B) Images of purified PSmOrange protein (40 µM, confocal microscope with commercial cryogenic stage) after activation at RT (Top) and cryogenic temperatures (Bottom). Red is the activated/switched state (Left), yellow/orange is the unactivated/unswitched state (Right). Note the clear activation in the red channel, and absence of fluorescence after switching in the yellow channel, in both RT and cryogenic conditions. (C) Activation (Top) and bleach (Bottom) rates for purified PaGFP (10 µM, Left) and PSmOrange (40 µM, Right). Activation graphs show the rate of activation from baseline to maximal activation, normalized for each individual run. Shaded regions around curves indicate SEM. Bleach curves represent the rate that activated/switched areas were bleached. (D) Scatter plot of purified PaGFP single-molecule data showing increased photon yield and detected single-molecule persistence at cryogenic temperatures (triangles) vs. RT (circles). (E) Radar plot quantifying single-molecule PaGFP data as in D, showing photon yield (mean and median), localization uncertainty, and the number of localized PaGFP molecules over a given area and exposures when imaging at RT vs. cryogenic temperatures. [Scale bars: 100 µm for A (all panels) and B (all panels).]
Fig. S1.
Activation and bleach curve fits for PaGFP and PSmOrange purified protein. (A) Activation curve fits for PaGFP (10 µM) and PSmOrange (40 µM) protein at RT and −140 °C. Whereas PaGFP showed no significant difference in activation rate at −140 °C vs. RT, PSmOrange showed a trend toward activating more slowly. Activation curves were fit with single exponentials. (B) Bleach curve fits for PaGFP (10 µM) and PSmOrange (40 µM) protein at RT and −140 °C. Both PaGFP and PSmOrange showed significantly slower bleach rates at −140 °C vs. RT. Bleach curves were fit with double exponentials and second tau is shown.
To determine whether bleach protection at cryogenic temperature results in increased photon yield and localization precision of individual molecules, we performed SMLM on PaGFP protein diluted on electron microscopy (EM) grids at RT, and then performed cPALM on the identical samples. We found that individual photoactivated PaGFP molecules imaged at −140 °C were ∼2.6-fold brighter (median photon count = 414.5 ± 68.7 vs. 157.6 ± 11.8, −140 °C vs. RT, respectively, P = 0.0001, Mann–Whitney U test, n = 3 samples per condition), lasted 2.1-fold longer (median frames detected = 3.4 ± 0.2 vs. 1.6 ± 0.07 frames, P = 0.00001, Mann–Whitney U test), and were localized with greater precision (15% decrease in error, median uncertainty of localization = 20.9 ± 0.02 vs. 24.1 ± 0.9 nm, P = 0.00001, Mann–Whitney U test; Fig. 2 D and E). Interestingly, in analyzing identical-sized areas with the same imaging parameters, there were ∼5.3-fold more localized molecules when imaging at −140 °C compared with RT (mean total points detected = 2,854 ± 233 vs. 536 ± 28, P = 0.01, unpaired two-tailed t test). Together, these results demonstrate that cPALM imaging results in a marked improvement in the photon yield and localization precision of individual fluorophores, and provides the unexpected benefit of allowing for more faithful reconstructions by increasing the number of detectable photoactivated molecules.
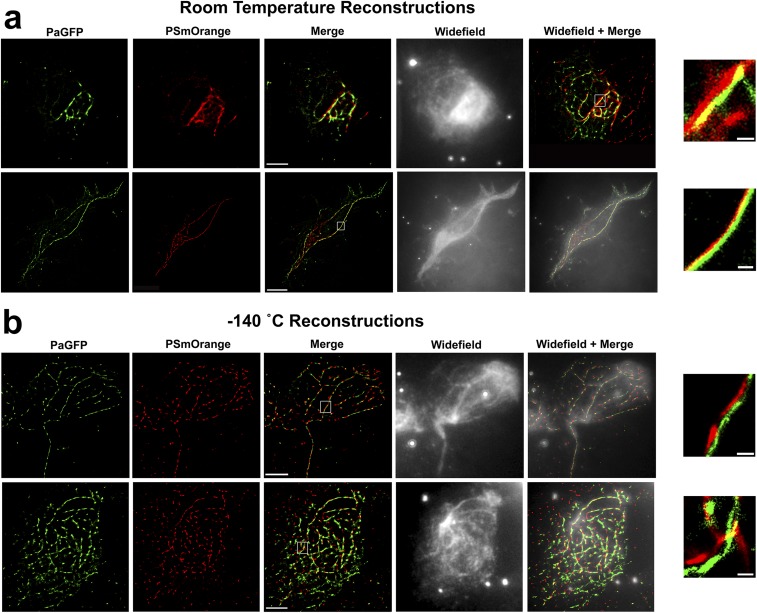
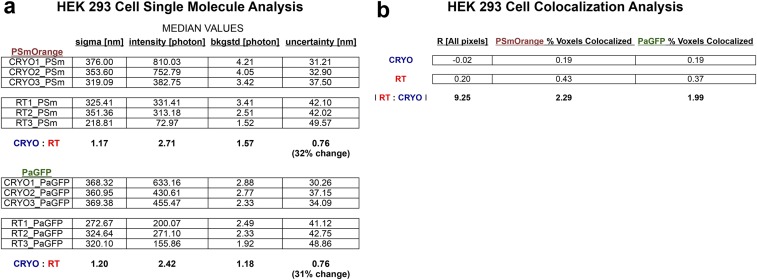
To examine whether these advantages generalized to cPALM imaging of complex subcellular structures, we grew HEK 293 cells on EM grids and then doubly transfected them with Utrophin–PaGFP and Vimentin–PSmOrange. Utrophin is an F-actin binding protein and can act as a reporter for polymerized actin filaments (17), whereas vimentin is an intermediate filament protein expressed in a complementary filamentous network (15). We next imaged these transfected cells using either PALM at RT or cPALM at −140 °C on the identical EM grids. Consistent with our single-molecule analyses of purified protein, we found that imaging these cytoskeletal networks using cPALM resulted in increased photon yields, an increase in the number of localized molecules per exposure, and greater precision in localizing and reconstructing these subcellular structures (Fig. 3A and Fig. S2). Specifically, imaging at cryogenic temperature resulted in a 2.4–2.7-fold increase in photon yield per detected molecule and a commensurate 31–32% reduction in single-molecule localization error (33.8 ± 2.0 vs. 44.2 ± 2.4 nm, and 33.9 ± 1.9 vs. 44.6 ± 2.5 nm, P = 0.03 for PaGFP and PSmOrange, cPALM vs. RT respectively, unpaired two-tailed t test) versus when imaging adjacent cells at RT (Fig. 3C).
Fig. 3.
Improved precision with cryogenic single-molecule localization microscopy. (A) HEK 293 cells transfected with Utrophin-PaGFP (actin, green) and Vimentin-PSmOrange (intermediate filaments, red). Cells imaged at RT or cryogenic temperatures were always compared with adjacent cells grown on the identical EM grid. (B) Magnified segments from white boxes shown in merged images, showing localization precision (as a function of plotted molecule size) and amount of colocalization for RT (Top) and cryogenic (Bottom) conditions. Pearson's r coefficients on bottom of images report the average pixel overlap (−1 = no overlap, +1 = complete overlap) for colocalized red and green pixels within regions of interest across the entire cell (n = 3 cells per condition). (C) Box plots displaying photon yield per molecule and localization uncertainty for Utrophin-PaGFP and Vimentin-PSmOrange at RT and −140 °C. Black bars indicate medians of distributions. (D) Box plots of Pearson’s r coefficients for colocalized red/green pixels in reconstructions from HEK cells at RT and −140 °C. (Scale bars: A, 5 µm, applies to all panels within each condition; B, 200 nm for top and bottom panels.)
Fig. S2.
Single-molecule reconstructions of PaGFP-Utrophin and PSmOrange-Vimentin in HEK 293 cells at RT and −140 °C. (A) Examples of PaGFP-Utrophin and PSmOrange-Vimentin reconstructions in HEK 293 cells using PALM at RT. (Top) Merge = 1,980 exposures, wide field + merge = 3,900 exposures (top panel shows merge without wide field for clarity). Note, compare the top merge panel in A (1,980 exposures) to the bottom merge panels in B (1,980 exposures). (B) cPALM reconstructions on adjacent cells to those shown in A. (Insets) Zoomed-in areas from white squares in merge panels. (Scale bars: 5 µm in merge for all panels, 200 nm for all insets.)
We reasoned that one method to verify that the reduction in single-molecule localization error resulted in a more precise cytoskeletal reconstruction would be to analyze the PaGFP and PSmOrange pixel overlap in regions across the cells where the two signals were in close proximity (i.e., ≤1 µm). We found that the correlation coefficient for overlapped pixels (−1 = no signal overlap, +1 = complete signal overlap) in these regions was significantly reduced (nearly 10-fold) when imaging at cryogenic temperature versus RT, indicating greater precision in resolving these two signals as evinced by the enhanced separation between the two complementary cytoskeletal reconstructions (R = 0.02 ± 0.04 vs. 0.2 ± 0.03, P = 0.02, unpaired two-tailed t test, n = 3 cells per condition; Fig. 3B and Fig. S3).
Fig. S3.
Single-molecule and colocalization analyses of PaGFP-Utrophin and PSmOrange-Vimentin in HEK 293 cells at RT and −140 °C. (A) Single-molecule analyses reveal a 2.7–2.4-fold increase in photon yield per molecule that results in a 32–31% decrease in localization uncertainty for PSmOrange and PaGFP at −140 °C vs. at RT. (B) Pearson’s r coefficient (−1 = no pixel overlap, +1 = complete pixel overlap) for regions of interest wherein PaGFP and PSmOrange signals were ≤1 µm from each other within HEK cells. Cells imaged at −140 °C had PaGFP-Utrophin and PSmOrange-Vimentin signals that were 9.25-fold less colocalized. In addition, the percent volume of each signal was between 2–2.3-fold (for PaGFP-Utrophin and PSmOrange-Vimentin, respectively) less colocalized at −140 °C than at RT.
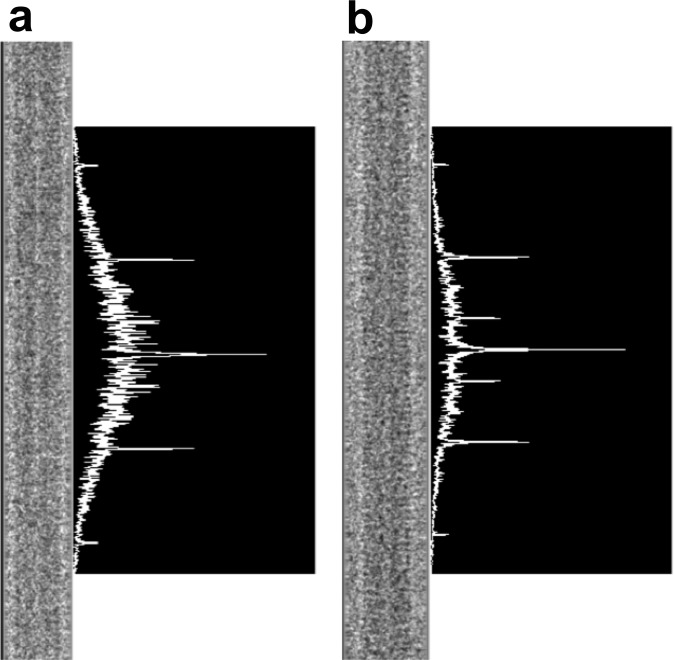
To verify that our cPALM approach is compatible with cryoEM, we generated cryoEM images of tobacco mosaic virus that had been treated with our cryofluid (3-methyl-1-pentene) at −145 °C and then rinsed with cold liquid ethane at −145 °C to elute the cryofluid before cryoEM imaging. When comparing these samples with identical samples that had been rinsed in ethane but not exposed to the cryofluid, we found that both treated and untreated samples showed reflections to 1.2-nm resolution (Fig. S4). Hence, contact with the cryofluid used for cPALM imaging does not alter the specimen at ∼1-nm resolution.
Fig. S4.
cPALM is compatible with cryoEM. Cryogenic electron micrographs of frozen-hydrated tobacco mosaic virus (TMV), a well-characterized test specimen, and projections of their Fourier transform intensities parallel to the equator. (A) “Untreated” TMV specimen that was only washed in liquid ethane at −145 °C. (B) “Treated” TMV specimen that was dipped in 4-methyl-1-pentene at −145 °C and then washed in liquid ethane at −145 °C. Both treated and untreated samples gave rise to sixth-order layer lines corresponding to a resolution of at least 1.2-nm resolution. This level of resolution is what one expects for the transforms of single particles. The exposure to the cryofluid and its removal were successful with no detectable damage to the TMV.
Interestingly, single-molecule analysis of purified PaGFP protein revealed a 2.6-fold increase in photon yield but only a 15% decrease in localization uncertainty. This potential discrepancy between theoretical and observed uncertainty is due to a relatively small increase in the Gaussian half-width (∼1.2-fold) and a doubling of the SD of background signal observed when imaging purified protein at cryogenic temperatures, possibly due to temperature-induced changes in focus that can be attributed to the slow cooling of the foam insulation of the stage. Combined, these factors fully accounted for the observed localization uncertainty of purified PaGFP molecules (Table S2). In contrast to the purified protein analyses, the observed Gaussian half-widths (1.2-fold larger) and background signals (1.2–1.6-fold larger) of Utrophin–PaGFP and Vimentin–PSmOrange at cryogenic temperature were only slightly higher than at RT. Accordingly, our observed 2.4–2.7-fold increase in photon yield in these cytoskeleton reconstruction experiments translated to a 31–32% decrease in localization uncertainty at −140 °C (Table S2).
Table S2.
Theoretical versus observed uncertainty calculations
| PaGFP purified protein | PaGFP-Utrophin in HEK cells | |||
| Variables | RT (PaGFP Protein) | Cryo (2.6N and 1.1S and 2b) | RT (PaGFP-Utrophin) | Cryo (2.4N and 1.2S and 1.4b) |
| S | 166.91 | 196.84 | 305.80 | 366.22 |
| N | 157.56 | 414.53 | 209.01 | 506.41 |
| b | 5.07 | 22.09 | 5.05 | 7.08 |
| Uncertainty, nm | 24.15 | 20.97 | 44.24 | 33.83 |
| RT/Cryo uncertainty, nm | 15% decrease (3.18 nm) | 31% decrease (10.41 nm) | ||
We used the freely available ImageJ plugin ThunderStorm to localize and fit molecular positions as well as reconstruct “superresolved” images. ThunderStorm takes into account EMCCD gain and photon/AD count and calculates localization uncertainty () based on this equation (8): , where S is the SD of the Gaussian fit, N is the number of photons captured from a given fluorescent molecule, a is the pixel size of the EMCCD detector, and b is the SD of the background signal. The table shows the median values we obtained in our PaGFP purified protein experiments and PaGFP-Utrophin experiments for S, N, and b at RT and cryogenic temperature. Increases in S and b at cryogenic temperature are responsible for limiting the effect of N on uncertainty. Hence, the observed values for uncertainty are fully accounted for by the changes in background signal and Gaussian fit at cryogenic temperature. We suspect that by adding an insulator that cools down faster than our closed-cell styrofoam, and rapidly accounting for changes in focus while imaging, uncertainty at cryogenic temperatures could be further reduced.
Previous reports of cryogenic SMLM techniques have used low-N.A. objective lenses to demonstrate that these tools can effectively couple information about molecular identity and localization with structural information from electron micrographs (11–13). In addition to these benefits, here we find that by using a high-N.A. lens the cPALM method produces more faithful and precise SMLM reconstructions that will enable higher resolution molecular maps of dense subcellular proteins. Importantly, the cPALM stage and objective collar can be customized to fit commercial upright fluorescent microscopes and commercially available high-N.A. objective lenses (Methods and Movies S1 and S2). We hope this higher resolution extension of the cPALM technique will expand the accessibility of this approach to a range of laboratories interested in precise reconstructions of complex subcellular targets.
Methods
Photoactivatable Constructs, Protein Purification, and Transfections.
Photoactivatable proteins and tagged constructs were purchased from Addgene: pRSETA-PAGFP was a gift from Jennifer Lippincott-Schwartz, Janelia Research Campus, Ashburn, VA (Addgene plasmid #11911), UtrCH-PaGFP was a gift from William Bement, University of Wisconsin-Madison, Madison, WI (Addgene plasmid #26738), and pBAD-PSmOrange and pVimentin-PSmOrange were gifts from Vladislav Verkhusha, Albert Einstein College of Medicine, Bronx, NY (Addgene plasmid #31886). To purify photoactivatable proteins, a single bacterial colony grown from an Addgene stab was picked from a fresh agar plate, and then grown in the presence of 20% arabinose and the appropriate selective antibiotic until logarithmic growth was achieved. Protein production was induced with 1 mM isopropyl β-d-1-thiogalactopyranoside and bacterial cultures were then allowed to incubate overnight in a 37 °C shaker. Next, bacterial cultures were centrifuged, lysed (CellLytic B Plus kit, Sigma, CB0050), and then purified using a His-nickel gravity column kit (Clontech 636658). Concentrated proteins were embedded in an 11–13% polyacrylamide gel for subsequent imaging at RT and cryogenic temperatures. Imaging of concentrated proteins at RT and −140 °C was performed using an air-coupled 10× lens and a commercially available cryogenic stage (Instec, Inc). For SMLM imaging of PaGFP, a small dab of 5 µM PaGFP protein in polyacrylamide gel was spread evenly onto a gold or molybdenum EM grid, and a 1.5-µL drop of 1:1,500 diluted Tetraspeck beads was placed on the sample and allowed to dry. These samples were then imaged using our cPALM stage. HEK 293 cells were doubly transfected with UtrCH-PaGFP and pVimentin-PSmOrange using polyethyleneimine (Polysciences, Inc., #23966) at a 2.5 µL: 1 or 1.5 µg DNA ratio. After 16–18 h, transfection media was replaced with fresh Dulbecco's modified Eagle medium and HEK cells were placed in a 37 °C incubator for 2–3 d before imaging. All cells (for RT and −140 °C experiments) were fixed in 4% paraformaldehyde in PBS (for 10 min) before imaging to control for any differences in precision or colocalization related to fixative-based preservation. However, to maximize ultrastructural preservation, most biological applications will likely benefit from using fast-frozen, unfixed samples.
cPALM Stage and Objective Collar Construction.
Before stage and objective collar construction, we first determined that we could theoretically maintain our sample below the threshold for ice crystal formation while imaging with a high-N.A. water immersion objective lens maintained at RT. We calculated these values based on the physics of heat flow and using COMSOL software to model the steady-state thermodynamics with our design materials (Table S1 and Fig. 1F). Once determining that these design constraints were feasible, we built successive versions of the cPALM stage and objective collar and eventually patented the current system (Publ US 2015/0248002 A1). Design elements and detailed scaled images for constructing a similar cryogenic stage and objective collar system can be found in this patent, as well as in the annotated computer-aided design (CAD) drawings available as Movies S1 and S2.
Optical Setup and Operation.
The principal elements of our microscope include three linearly polarized lasers: a 473-nm diode laser (103 mW, Laserglow LRS-0473-PFM-00050-05), a 643-nm diode laser (53 mW, CrystaLaser DL640-050), and a 405-nm diode laser (50 mW, Coherent 1069413/AT). Lasers were aligned and directed up to a rigidly supported vertical breadboard that housed all of the optical elements and camera. All lasers were fed into a computer-controlled motorized filter wheel (Thorlabs FW103) altered to operate perpendicular to the vertical breadboard. Lasers were directed 90° downward toward the back aperture of the objective lens by appropriate dichroic lenses, and matching notch filters restricted fluorescence emission to the camera. Fluorescent images were captured by a cooled back-illuminated EMCCD (Andor, DU-897E) with a 512 × 512 16-µm2 pixel detector. Our measured laser power density ranges at the sample were as follows: 473-nm laser (readout: 80–150 W/cm2, activation: 10–18 W/cm2), 643-nm laser (readout: 108–355 W/cm2), and 405-nm laser (activation: 0.8–12.7 W/cm2). We used 0.1-s exposures for readout beams and between 0.01- and 0.5-s exposures to photoactivate our samples with either the 405- or 473-nm lasers.
To maintain optical coupling of the objective lens and the specimen at ≤−135 °C, we needed a cryofluid with a refractive index close to that of water, a boiling point well above −23 °C (the calculated temperature at the bottom of the coverslip as shown in Table S1), and a freezing point below −140 °C. Listed below are the three we tested:
| Cryofluid | Freezing point, °C | Boiling point, °C | Refractive index |
| 3-methyl-1pentene | −154 | +54 | 1.38 |
| 4-methyl-1-pentene | −153 | +54 | 1.38 |
| 70% methanol: 30% 1-propanol | ∼−148 | >+25 | ∼1.38 |
We primarily used the 70:30% methanol:1-propanol mixture as it had superior surface tension and was less volatile than the pentene fluids. In addition, we used 70% ethanol in dH2O as an objective immersion fluid (between the objective lens and attached coverslip) because we found that dH2O alone tended to freeze when using the relatively slow peristaltic pumping speeds required to prevent pressure-induced image artifacts.
We imaged in one of two ways: (i) we placed the EM sample grid on the stage, filled the reservoir with coupling fluid, and then proceeded to focus down on the sample as the stage reached −140 °C, or (ii) in experiments aimed at preserving native ultrastructure we kept the sample under LN2 until the stage cooled down to −140 °C and then secured the sample on the stage. We then poured some LN2 into the sample tray and dropped some cryofluid into the tray. Next we carefully picked up the now-frozen drop of cryofluid from the LN2 in the sample tray, placed it over the sample, and then lowered the objective lens and collar unit just above the cryofluid to cool and dry the coverslip to cryogenic temperature. Once the coverslip, cryofluid, and sample had reached −140 °C, we lowered the objective lens onto the sample and began imaging. Sample temperature was continually monitored with a thermocouple embedded in the copper sample rod, directly under the sample. If the sample temperature fell lower than −148 °C (cryofluid freezing point) or above −135 °C (ice crystal formation threshold), imaging runs were aborted and data were excluded from our analyses.
SMLM Acquisition and Analysis.
We wrote custom LabVIEW software routines to control and synchronize all aspects of our image acquisition, including all of the lasers, filter sets, shutters, EMCCD, and A/D devices in our system. We used the ImageJ plugin ThunderStorm (18) to localize, fit, and reconstruct our RT PALM and cPALM data. ThunderStorm is an open-source platform that uses published, well-characterized methods to localize and fit single molecules and calculate uncertainty (Table S2). Briefly, ThunderStorm fits a peak using an image-filtering algorithm (in our case a Wavelet filter with B-spline order = 3 and scale =2) within a certain threshold [we used 1.2*SD (Wave.F1)]. To calculate the background value (Table S2), Thunderstorm subtracts the fitted model from the raw data, and the SD of this residual image is then used as the background value. Stage drift was tracked by doping each purified protein or HEK 293 sample with a 1:1,500 dilution of multicolor 200-nm fluorescent beads (Tetraspeck, Invitrogen, T-7280). Drift in X/Y was corrected using the fiducial marker drift correction function in ThunderStorm. PaGFP-Utrophin and PSmOrange-Vimentin reconstructions were aligned using the centroid positions of the reconstructed multicolor fluorescent beads. Localized molecules with Gaussian fit (σ-) values ≥600 nm were excluded from our reconstructions. The precision was calculated from the observed profiles of the emitters. We did not attempt to test the precision by multiple observations of a single emitter, nor were positional shifts calculated with defocus because data from these methods become more difficult to interpret when other sources of error, such as the observed temperature-induced changes in focus, randomly shift the apparent focus of the emitters. In addition, because our estimates of localization uncertainty across all emitters were performed identically between RT and −140 °C experiments, we have highlighted this relative difference in precision between the two conditions.
In addition, because the emitter dipoles in our frozen samples were likely less mobile than emitter dipoles in RT samples, we expect that our ability to excite our frozen samples with our linearly polarized lasers was reduced. Hence, our observed increases in the numbers of emitters and the emitter brightness in frozen versus RT samples likely approximate the minimal possible increases. Importantly, there are other sources of error in localizing single emitters. For example, there is inherent optical inhomogeneity in most samples, which we did not attempt to quantify. Also, fluid flow from left to right between the lens and the coverslip in our objective collar system might induce small errors in localization. By calculation, assuming the flowing immersion fluid drops by about 20 °C as it flows along the coverslip, there is a left–right temperature drop of about 19 °C along the middle of the coverslip, and a 10 °C left–right drop across the middle of the cryofluid layer, but essentially no temperature drop along the sample. These temperature drops cause a gradient of refractive index and thickness that act as a prism to deflect the light. Ignoring the cryofluid for which there are no data, the effect on the water and glass coverslip corresponds to an apparent displacement of less than 1 nm at the sample. Moreover, the change in refractive index is about the same for the two wavelengths we used, meaning the beams are equally deflected.
Supplementary Material
Acknowledgments
This work was supported by NIH Director's Pioneer Award DP10D003388 (to G.G.T.) and NIH Grant R37NS092635 (to G.G.T.).
Footnotes
Conflict of interest statement: The authors built successive versions of the cPALM stage and objective collar and eventually patented the current system (Publ US 2015/0248002 A1). Design elements and detailed scaled images for constructing a similar cryogenic stage and objective collar system can be found in this patent, as well as in the annotated computer-aided design (CAD) drawings available as Movies S1 and S2.
This article contains supporting information online at www.pnas.org/lookup/suppl/doi:10.1073/pnas.1618206114/-/DCSupplemental.
References
- 1.Betzig E, et al. Imaging intracellular fluorescent proteins at nanometer resolution. Science. 2006;313:1642–1645. doi: 10.1126/science.1127344. [DOI] [PubMed] [Google Scholar]
- 2.Rust MJ, Bates M, Zhuang X. Sub-diffraction-limit imaging by stochastic optical reconstruction microscopy (STORM) Nat Methods. 2006;3:793–795. doi: 10.1038/nmeth929. [DOI] [PMC free article] [PubMed] [Google Scholar]
- 3.Hess ST, Girirajan TP, Mason MD. Ultra-high resolution imaging by fluorescence photoactivation localization microscopy. Biophys J. 2006;91:4258–4272. doi: 10.1529/biophysj.106.091116. [DOI] [PMC free article] [PubMed] [Google Scholar]
- 4.Nienhaus K, Nienhaus GU. Where do we stand with super-resolution optical microscopy? J Mol Biol. 2016;428:308–322. doi: 10.1016/j.jmb.2015.12.020. [DOI] [PubMed] [Google Scholar]
- 5.Xu K, Zhong G, Zhuang X. Actin, spectrin, and associated proteins form a periodic cytoskeletal structure in axons. Science. 2013;339:452–456. doi: 10.1126/science.1232251. [DOI] [PMC free article] [PubMed] [Google Scholar]
- 6.Shroff H, Galbraith CG, Galbraith JA, Betzig E. Live-cell photoactivated localization microscopy of nanoscale adhesion dynamics. Nat Methods. 2008;5:417–423. doi: 10.1038/nmeth.1202. [DOI] [PMC free article] [PubMed] [Google Scholar]
- 7.Yu J. Single-molecule studies in live cells. Annu Rev Phys Chem. 2016;67:565–585. doi: 10.1146/annurev-physchem-040215-112451. [DOI] [PubMed] [Google Scholar]
- 8.Thompson RE, Larson DR, Webb WW. Precise nanometer localization analysis for individual fluorescent probes. Biophys J. 2002;82:2775–2783. doi: 10.1016/S0006-3495(02)75618-X. [DOI] [PMC free article] [PubMed] [Google Scholar]
- 9.Nienhaus K, Nienhaus GU. Fluorescent proteins for live-cell imaging with super-resolution. Chem Soc Rev. 2014;43:1088–1106. doi: 10.1039/c3cs60171d. [DOI] [PubMed] [Google Scholar]
- 10.Werner TC, Bunting JR, Cathou RE. The shape of immunoglobulin G molecules in solution. Proc Natl Acad Sci USA. 1972;69:795–799. doi: 10.1073/pnas.69.4.795. [DOI] [PMC free article] [PubMed] [Google Scholar]
- 11.Chang YW, et al. Correlated cryogenic photoactivated localization microscopy and cryo-electron tomography. Nat Methods. 2014;11:737–739. doi: 10.1038/nmeth.2961. [DOI] [PMC free article] [PubMed] [Google Scholar]
- 12.Kaufmann R, et al. Super-resolution microscopy using standard fluorescent proteins in intact cells under cryo-conditions. Nano Lett. 2014;14:4171–4175. doi: 10.1021/nl501870p. [DOI] [PMC free article] [PubMed] [Google Scholar]
- 13.Liu B, et al. Three-dimensional super-resolution protein localization correlated with vitrified cellular context. Sci Rep. 2015;5:13017. doi: 10.1038/srep13017. [DOI] [PMC free article] [PubMed] [Google Scholar]
- 14.Le Gros MA, McDermott G, Uchida M, Knoechel CG, Larabell CA. High-aperture cryogenic light microscopy. J Microsc. 2009;235:1–8. doi: 10.1111/j.1365-2818.2009.03184.x. [DOI] [PMC free article] [PubMed] [Google Scholar]
- 15.Subach OM, et al. A photoswitchable orange-to-far-red fluorescent protein, PSmOrange. Nat Methods. 2011;8:771–777. doi: 10.1038/nmeth.1664. [DOI] [PMC free article] [PubMed] [Google Scholar]
- 16.Schwartz CL, Sarbash VI, Ataullakhanov FI, McIntosh JR, Nicastro D. Cryo-fluorescence microscopy facilitates correlations between light and cryo-electron microscopy and reduces the rate of photobleaching. J Microsc. 2007;227:98–109. doi: 10.1111/j.1365-2818.2007.01794.x. [DOI] [PubMed] [Google Scholar]
- 17.Burkel BM, von Dassow G, Bement WM. Versatile fluorescent probes for actin filaments based on the actin-binding domain of utrophin. Cell Motil Cytoskeleton. 2007;64:822–832. doi: 10.1002/cm.20226. [DOI] [PMC free article] [PubMed] [Google Scholar]
- 18.Ovesný M, Křížek P, Borkovec J, Svindrych Z, Hagen GM. ThunderSTORM: A comprehensive ImageJ plug-in for PALM and STORM data analysis and super-resolution imaging. Bioinformatics. 2014;30:2389–2390. doi: 10.1093/bioinformatics/btu202. [DOI] [PMC free article] [PubMed] [Google Scholar]
Associated Data
This section collects any data citations, data availability statements, or supplementary materials included in this article.


