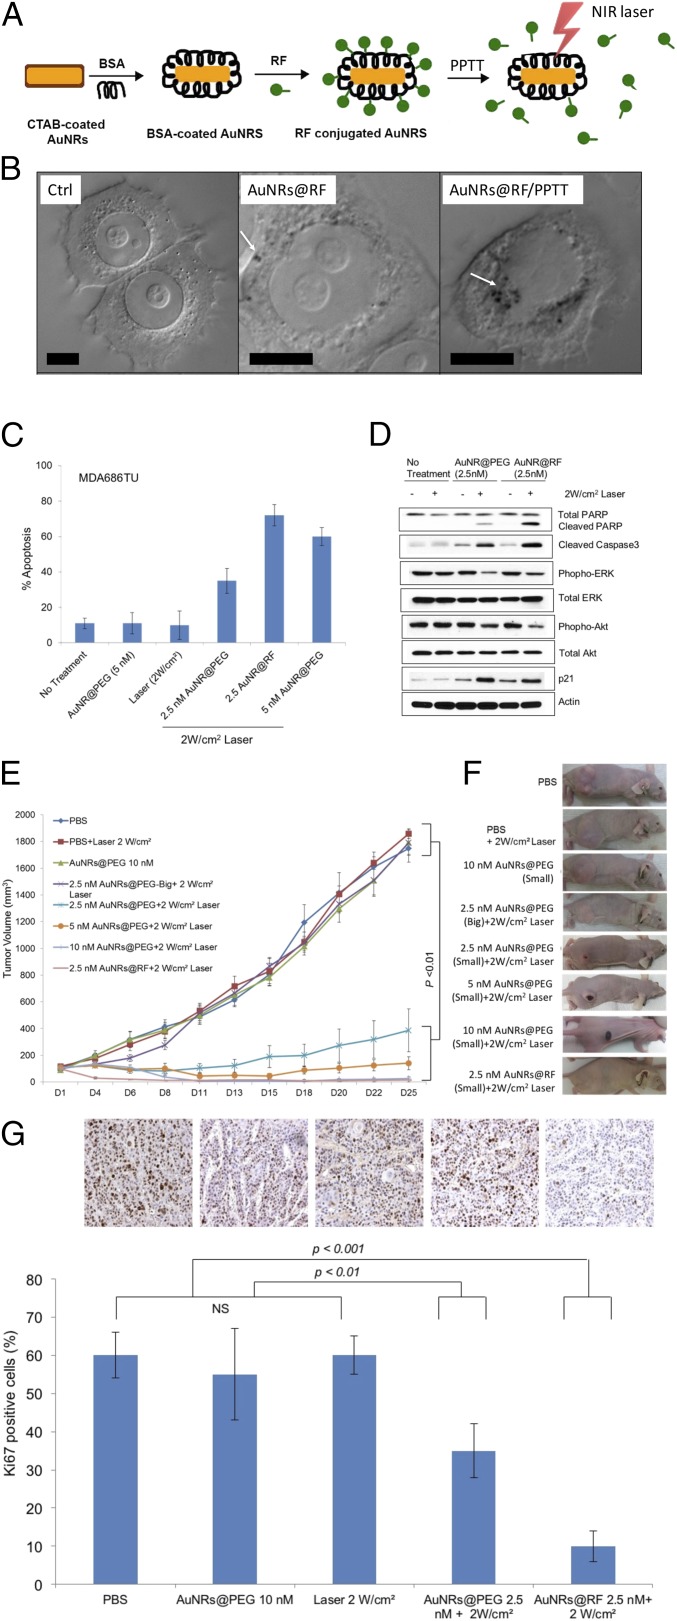
Fig. 1.
Efficacy of AuNRs@RF in vivo and in vitro. (A) Schematic showing the characterization and conjugation of AuNRs@Rifampicin and the release of surface ligands after PPTT. (B) DIC images of optical sectioning of control sample (without nanoparticles), cells incubated with AuNRs@RF, and cells after PPTT. White arrows indicate AuNRs aggregates. (Scale bars, 10 µm.) (C) Comparative apoptosis analysis in MDA686TU HNSCC cells treated with AuNRs or AuNRs@RF and PPTT after 72h (error bars are mean ± SD, n = 3). (D) Western blotting for the indicated proteins in MDA686TU HNSCC cell line after treatment with AuNRs@PEG-PPTT and AuNRs@RF-PPTT. A representative blot of three independent experiments is presented. (E) MDA686TU HNSCC tumor xenograft growth (tumor volume = 0.5×l×w2) progression in groups: PBS, 2 W/cm2 laser, 10 nM small AuNRs@PEG as control groups; 5 nM, 10 nM small AuNRs@PEG with 2W/cm2 laser; 2.5 nM small and large AuNR@PEG with 2 W/cm2 laser; 2.5 nM AuNRs@RF with 2 W/cm2 laser. First and only dose was given on day 1 (tumor volume ∼70 mm3) and tumor growth was monitored until day 25 (endpoint of tumor volume 1,800 mm3) (error bars are mean ± SEM, n = 5). Statistical analysis (t test) between control groups (PBS, laser, and AuNRs@PEG) vs. treated groups (2.5, 5, and 10 nM AuNRs@PEG-PPTT, 2.5 nM AuNRs@RF-PPTT) was P < 0.01. (F) Representative mouse from each of the indicated groups presented. (G) Ki-67 expression detected in xenograft tissue by IHC analysis. Representative images shown from indicated groups (brown stain for Ki-67 and nuclei were counterstained by hematoxylin, blue; magnification ×200). For comparison with other studies, 5 nM = 1 OD for small AuNRs (35).

