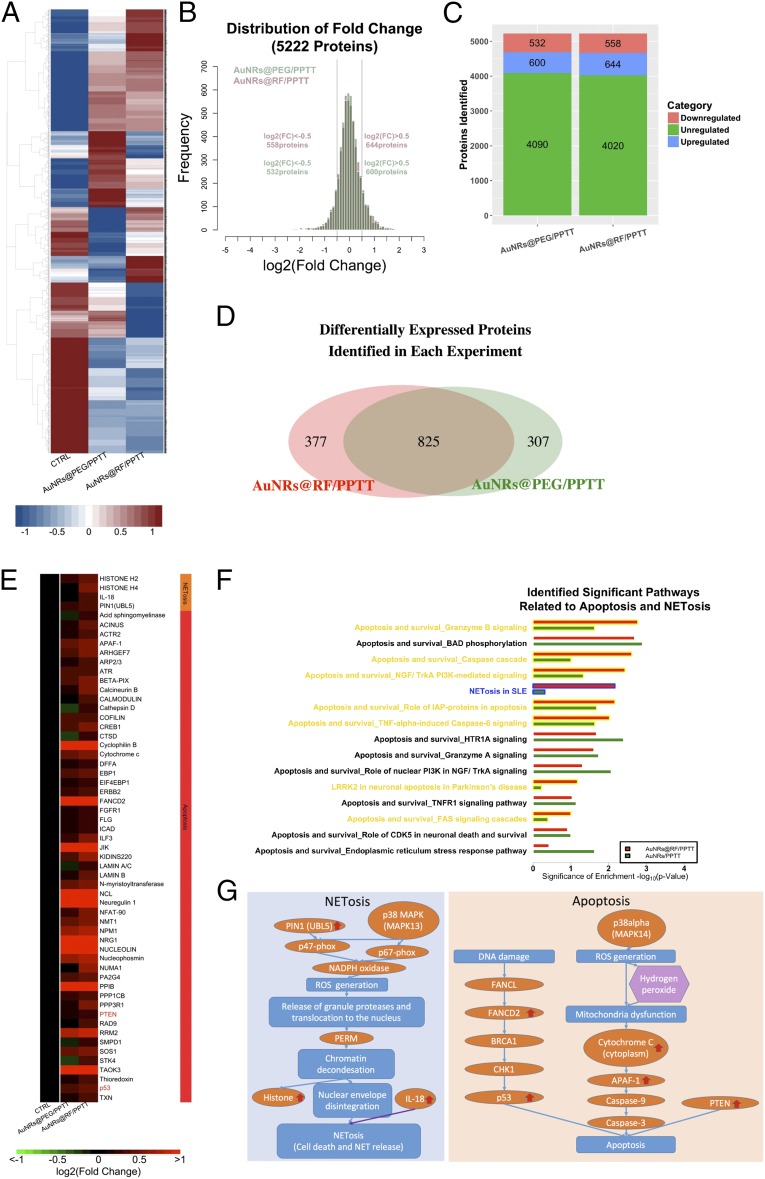
Fig. 2.
Quantitative proteomics. (A) Comprehensive heat map showing the proteome perturbed by AuNRs@PEG-PPTT and AuNRs@RF-PPTT compared with control group. (B) Distribution of fold changes in proteins perturbed by AuNRs@PEG-PPTT and AuNRs@RF-PPTT compared with control group. (C) Bar graph showing numbers of proteins unregulated, increased, and decreased in each group. (D) Venn diagram showing the differentially expressed proteins identified in each group. (E) Heat map for proteins related to apoptosis and NETosis contributing to the better efficacy of AuNRs@RF-PPTT compared with AuNRs@PEG-PPTT. The values of protein fold change are listed in Dataset S1. (F) Identified significant pathways related to apoptosis and NETosis. (G) Simplified pathway map of NETosis and apoptosis.

