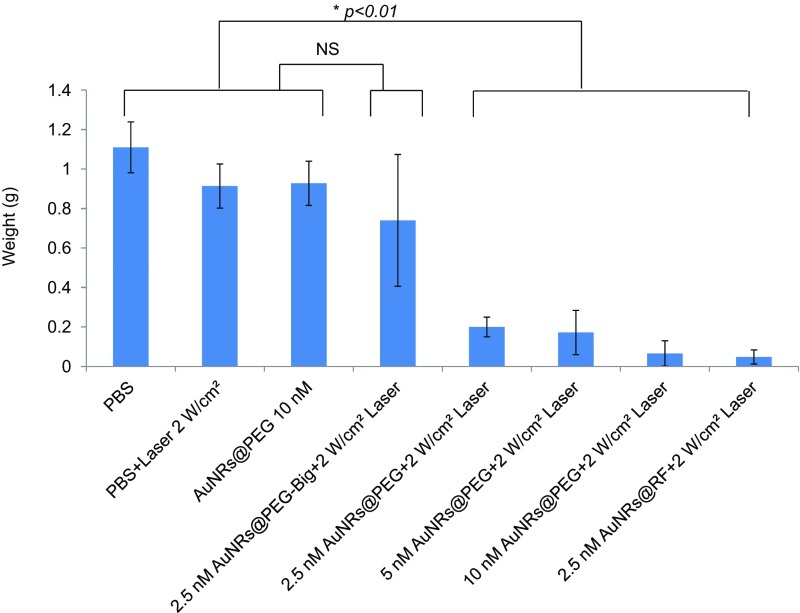
Fig. S6.
Tumor weight of treated mice. Mice were killed, tumors were collected from each treatment group on day 25, and tumors were weighed (error bars are mean ± SD, n = 5). Statistical analysis (t test) shows that the difference between control (PBS, laser, and AuNRs@PEG) vs. the big AuNRs@PEG-treated group was not significant (NS), whereas control (PBS, laser, and AuNRs@PEG) vs. other treated groups was *P < 0.01. For comparison with other studies, 5 nM = 1 OD for small AuNRs (35).

