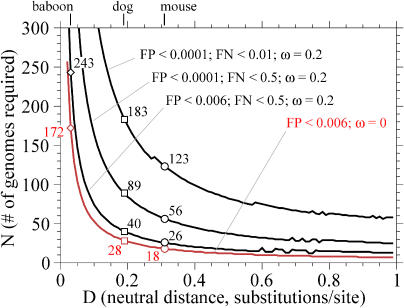
Figure 1. Number of Genomes Required for Single Nucleotide Resolution.
The red line plots genome number required for identifying invariant sites (ω = 0) with a FP of 0.006, essentially corresponding to the Cooper model [7]. Black lines show three more parameter sets: identifying 50% (FN < 0.5) of conserved sites evolving 5-fold slower than neutral (ω = 0.2) with FP < 0.006, doing likewise but with a more-stringent FP of 0.0001, and identifying 99% of conserved sites instead of just half of them. Values of N at baboon-like, dog-like, and mouse-like neutral distances are indicated with diamonds, squares, and circles, respectively. Jaggedness of the lines here and in subsequent figures is an artifact of using discrete N, L, and cutoff threshold C to satisfy continuous FP and FN thresholds.

