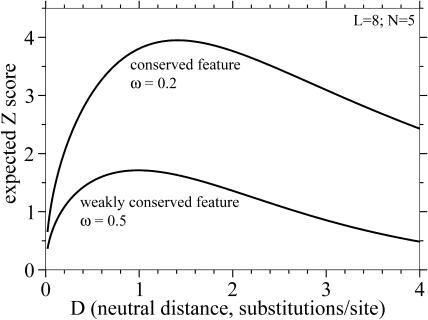
Figure 3. A Measure of Statistical Strength As a Function of Neutral Evolutionary Distance.
One convenient threshold-independent measure of the strength of a comparative analysis is an expected Z score, the expected difference Δc in the number of substitutions in a neutral feature alignment versus a conserved feature alignment, normalized to units of standard deviations. E(Z) is readily calculated for the binomial distribution:
where pn and pc are the probabilities of observing a change at one aligned comparative nucleotide according to the Jukes-Cantor equation.
The plots here are for N = 5 and L = 8. The shape of the curve is independent of N and L, while the absolute magnitude of Z scales as √NL . The x-axis is shown from D = 0 to D = 4, beyond the more realistic range of Figures 1 and 2, to show the mathematically optimum D if homologous conserved features were present, recognized, and accurately aligned at any D.

