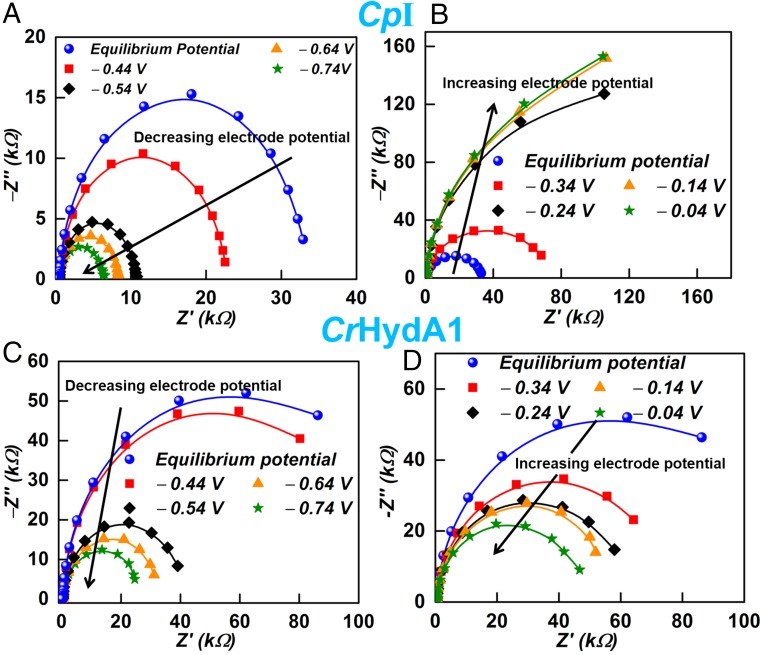
Fig. 6.
Impedance measurements at various potentials vs. SHE: (A) at electrode potentials where CpI catalyzes net H+ reduction [black arrow signifies decreasing (more negative) electrode potential]; (B) at electrode potentials where CpI catalyzes the net oxidation of H2 [black arrow signifies increasing (more positive) electrode potential]; (C) at electrode potentials where CrHydA1 catalyzes net H+ reduction [black arrow signifies decreasing (more negative) electrode potential]; (D) at electrode potentials where CrHydA1 catalyzes the net oxidation of H2 [black arrow signifies increasing (more positive) electrode potential]. Conditions: pH 7.0 (0.10 M phosphate buffer), temperature, 0 °C. The symbols are experimental data points, and the lines are the theoretical fit.

