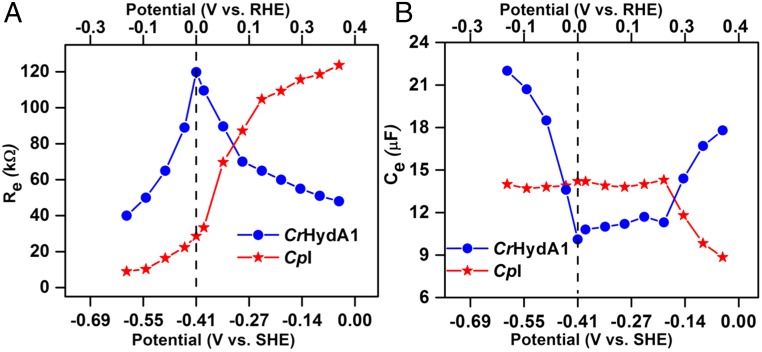
Fig. 7.
Potential-dependent variation of (A) Re, and (B) Ce, extracted from the low-frequency arcs of Nyquist spectra at various potentials for the [FeFe]-hydrogenases adsorbed on a PGE electrode. The symbols are experimental data points, and the lines are included to guide the eye. The vertical broken line marks the formal reversible hydrogen potential (RHE) derived from the measured zero-current potential and used to correlate the upper RHE scale with the lower SHE scale.

