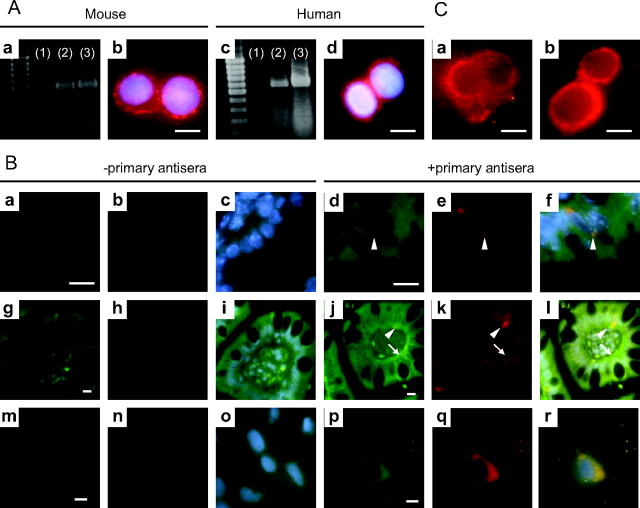
Fig. 1.
Expression of the insulin receptor and activation of PI3 kinase in L cells. A, Semiquantitative RT-PCR analysis for insulin receptor mRNA transcripts in GLUTag (a: lane 2) and NCI-H716 cells (c: lane 2). Mouse fat (a: lane 3) and human placenta (c: lane 3) were used as positive controls, respectively, whereas the omission of template RNA was used as negative controls (a: lane 1, c: lane 1). Murine GLUTag (b) and human NCI-H716 (d) cells were subjected to immunofluorescent staining for the insulin receptor β-subunit (red); 4′,6′-diamino-2-phenylindole (DAPI; blue) was used to visualize nuclei. B, Mouse (a–f) and human (g–l) intestinal sections and FRIC cultures (m–r) were subjected to double-immunofluorescent staining for the insulin receptor α-subunit (green) and GLP-1 (red); DAPI (blue) was used to visualize nuclei. The absence of primary antisera was used as negative controls (mouse: a–c; human: g–i; FRIC: m–o). Arrowheads indicate L cells, and arrows indicate basolateral staining for the insulin receptor α-subunit. Colocalization of the insulin receptor and GLP-1is indicated by yellow in the overlay (f, l, and r). C, Immunofluorescent detection of PIP3 production (red) in response to treatment of GLUTag cells with media alone (a) or 10−7 m insulin (b) for 5 min. Identical camera exposure times were used. Scale bars, 10 μm.

