
Fig. 3.
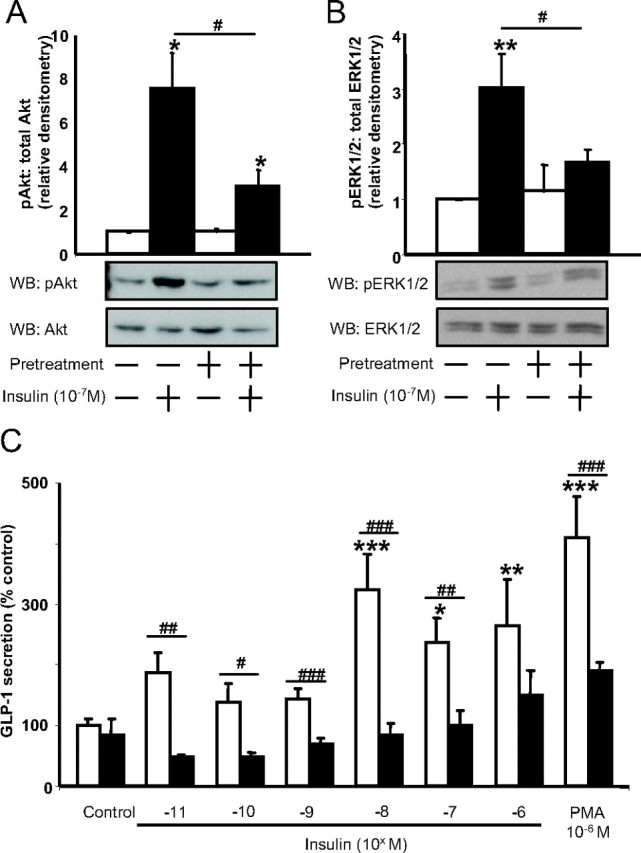
Effect of insulin and insulin resistance on human NCI-H716 cells. Cells were exposed for 24 h to either media alone or high insulin to induce insulin resistance and, after three 40-min washes with serum-free media containing 1% BSA, were treated acutely with 10−7 m insulin for 5 min for Western blot analysis (WB) or with graded concentrations of insulin or PMA for 2 h to measure GLP-1 secretion. A and B, Crude protein lysates were subjected to immunoblot analysis for Akt phosphorylation (n = 4/group) (A) or ERK1/2 phosphorylation (n = 4/group) (B). All values were expressed relative to the untreated control, and representative blots are shown. *, P < 0.05, **, P < 0.01 when compared with untreated control; #, P < 0.05 as indicated. C, GLP-1 secretion in response to medium alone (control), graded concentrations of insulin, or PMA from normal (open bars) or insulin-resistant (closed bars) NCI-H716 cells. GLP-1 secretion was determined by RIA, and all data were expressed as a percent of the untreated control (n = 5–6/group). *, P < 0.05, **, P < 0.01, ***, P < 0.001 when compared with untreated control; #, P < 0.05, ##, P < 0.01, ###, P < 0.001 as indicated. p, Phospho.