
Fig. 7.
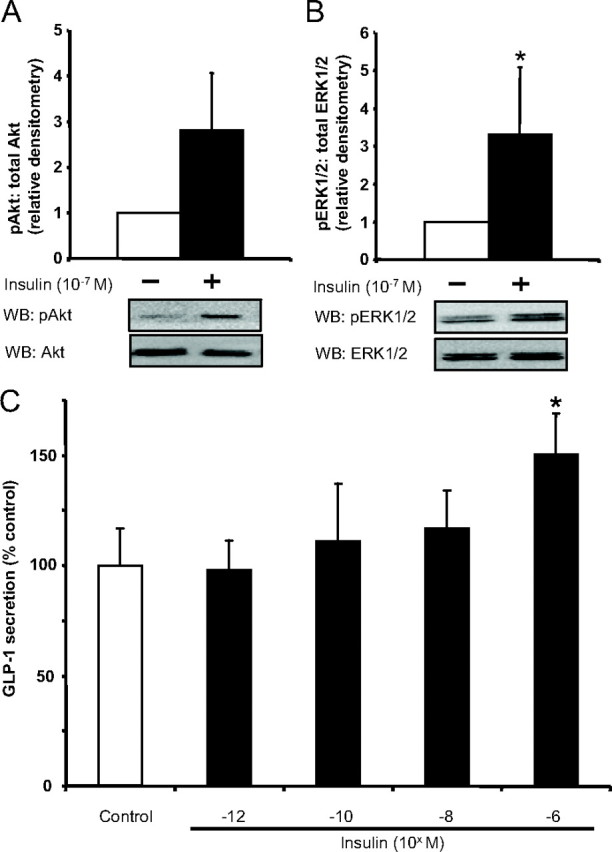
Effects of insulin on FRIC cultures. A and B, FRIC cultures were treated with 10−7 m insulin for 5 min, and cell lysates were collected for analysis of Akt (n = 4/group) (A) and ERK1/2 (n = 4/group) (B) phosphorylation by Western blot analysis (WB). *, P < 0.05. All data were expressed as a fold over control, and representative blots are shown. C, Separate FRIC cultures were treated for 2 h with different concentrations of insulin, and GLP-1 secretion was determined by RIA (n = 8/group). *, P < 0.05 when compared with the untreated control. p, Phospho.