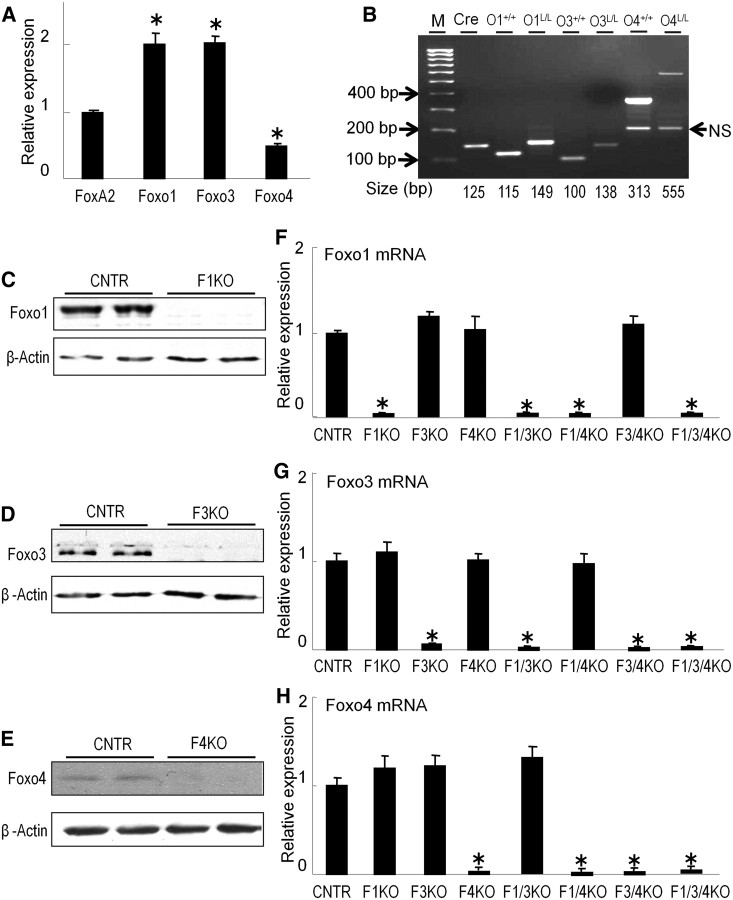
Fig. 1.
Relative expression levels of Foxo genes in the liver of mice and mice lacking Foxo1, Foxo3, and Foxo4. A, The liver of random-fed C57/BL6 at the age of 10 wk was collected and RNA was analyzed by real-time PCR. Values are relative to FoxA2 gene RNA (mean ± sem). *, P < 0.01 (n = 3). B, Genotyping of Cre, floxed Foxo alleles by PCR. Integration of Cre or insertion of 34 bp of loxp sites in Foxo1 and Foxo3 alleles caused an up-shift of the PCR product in 2% agarose gel and stained with ethidium bromide. The sizes of PCR products are indicated. L/L, Loxp homozygous; +/+, wild-type alleles; M, 100 bp DNA ladder. PCR primers 5′-gcttacagcagagatgttctcacatt, 5′-ccagagtctttgtatcaggcaaataa, and 5′-caagtccattaattcagcacattga are for Foxo1; 5′-attcctttggaaatcaacaaaactg, 5′-tgctttgatactattccacaaaccc, and 5′-agatttatgttcccacttgcttcct are for Foxo3; 5′-gctttcttagtgaaggatgggaaa, 5′-attccttcccttttcacccact, and 5′ cttctctgtgggaataaatgtttgg for Foxo4; 5′-agatgttcggcgattatcttc and 5′-ccagtgaaacagcattgctg are for Cre; NS, Nonspecific band. C–E, Protein content of Foxo1, Foxo3, and Foxo4 analyzed by specific immunoblotting of liver lysates extracted from 10-wk-old control (CNTR), F1KO, F3KO, or F4KO mice (n = 2 mice/group). F–H, Relative expression levels of Foxo1, Foxo3, and Foxo4 in the mutant mice. The liver of random-fed F1KO, F3KO, F4KO, F1/3KO, F1/4KO, F3/4KO, and F1/3/4KO mice at the age of 10–12 wk was collected and Foxo mRNA was analyzed by real-time PCR. Values are relative to the liver of control mice. *, P < 0.01 vs. control (n = 3/group).

