
Fig. 8.
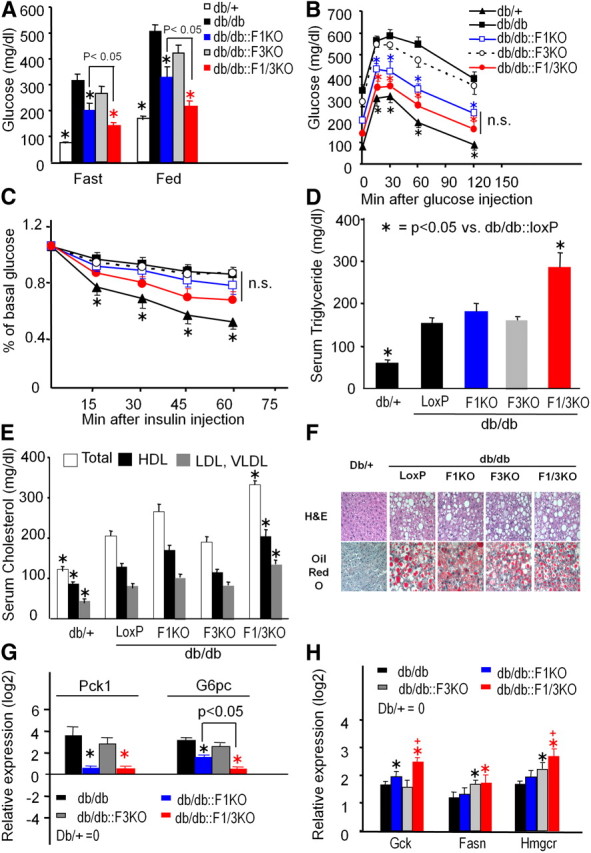
Glucose and lipid homeostasis in db/db mice lacking hepatic Foxo1 and Foxo3 genes. A, Blood glucose concentrations were measured from 18-h fasting or random-fed db/db mice with different Foxo inactivation. Data are shown average ± sem. *, P < 0.05 vs. db/db mice (n = 6). Glucose (B) and insulin tolerance tests (C) of 10-wk-old male db/db mice with hepatic Foxo inactivation. *, P < 0.05 vs. db/db mice. n.s, No significant difference (n = 6). D, Serum triglyceride concentrations of 18-h fasted db/db mice with hepatic Foxo deficiency. *, P < 0.05 vs. db/db mice (n = 4). E, Total cholesterol, HDL-cholesterol, and VLDL/LDL-cholesterol concentrations in serum from 18-h fasted mice. *, P < 0.05 vs. db/db control (n = 4). F, Liver sections of H&E and oil red O staining from db/+ and db/db mice with Foxo inactivation (magnification, ×200) are shown. Photos are representative from at least four sections per genotype. Relative expression levels of genes encoding Pck1 and G6pc (G) and lipogenic enzymes Gck, Fasn, and Hmgcr (H) were measured by real-time PCR in the liver of 18-h fasted mice. Expression level of each gene normalized by cyclophilin are shown at a log2 scale (mean ± sem), and expression level of control liver was set up as log21 = 0. *, P < 0.05 vs. db/db mice; +, <0.05 vs. db/db::F1KO (n = 3).