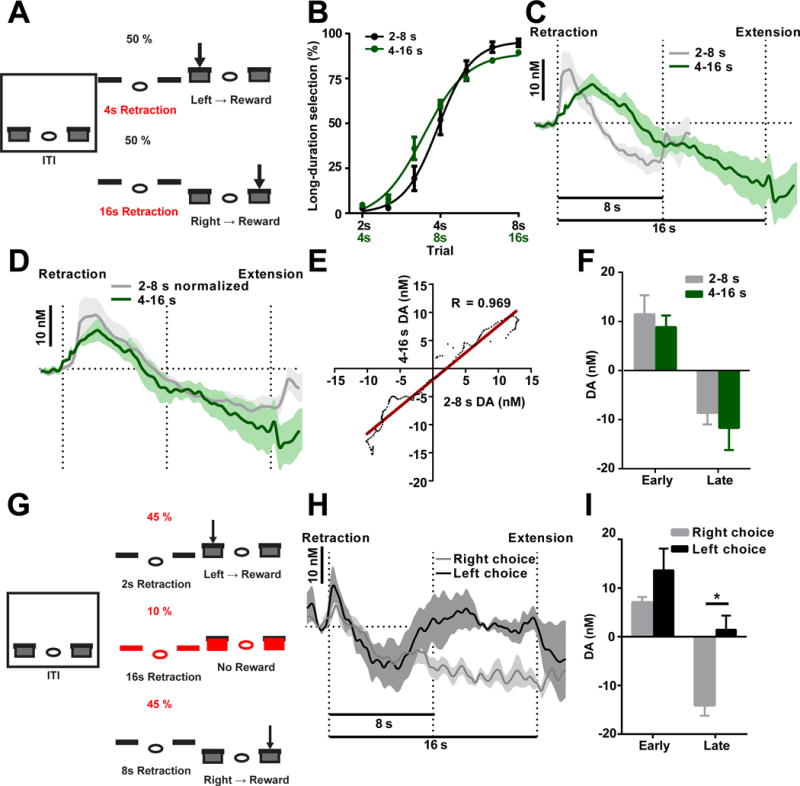
Figure 3. Dopamine changes are scalable to time intervals and are related to action selection.

(A) Task design for the 4–16 s task. (B) Psychometric curves for mice trained on 2–8 s task (black) and 4–16 s task (green). n = 7 for 2–8 s, n = 4 for 4–16 s. P > 0.05; two-way repeated measures ANOVA. (C) Dopamine recorded during the 16 s trials in the 4–16 s. (D and E) Dopamine recorded in both tasks are normalized to fit the same timescale (D), and they are significantly correlated (E; R = 0.969, P < 0.0001). (F) Dopamine magnitude is similar during the early (unpaired t-test, P > 0.05, n = 6 for 4–16 s, n = 11 for 2–8 s) and late phases (unpaired t-test, P > 0.05, n = 6 for 4–16 s, n = 11 for 2–8 s). (G) Task diagram for 16 s probe trials. (H) Dopamine recorded in 16 s probe trials (black: short-duration lever selection; grey: long-duration lever selection). (I) Dopamine signaling in the early phase (paired t-test, P > 0.05, n = 4) and late phase (paired t-test, P > 0.05, n = 4).
