
Figure 2.
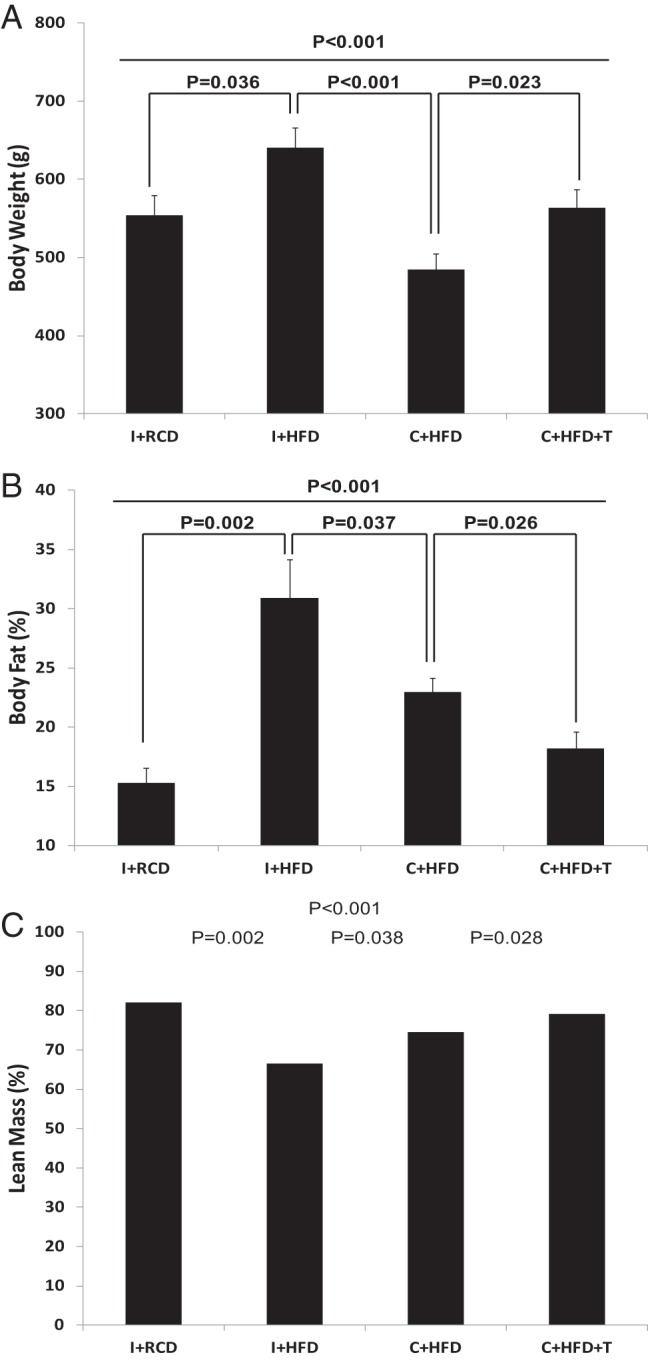
Body composition analyses at the end of the feeding experiment. A, Body weight was different among the groups (overall group comparison P < .001). B, Percentage body fat was different among the groups (overall group comparison P < .001). C, Percentage lean mass was different among the groups (overall group comparison P < .001).