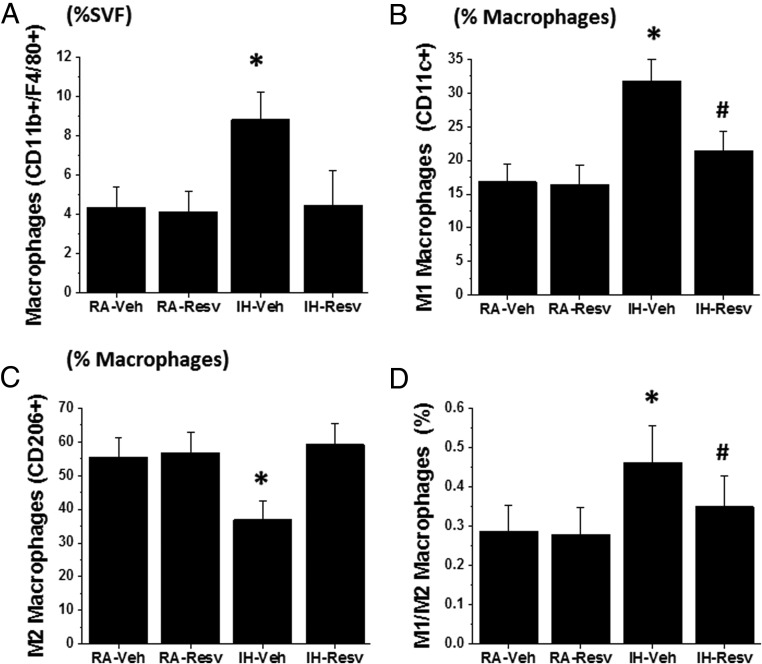
Figure 3. Macrophage cell recruitment in SVF of VWAT in IH and RA-exposed mice treated with either Resv or Veh for 8 weeks.
A, Total macrophage count expressed as percentage of cells isolated from SVF. B, M1 macrophage count expressed as percentage of total macrophage count. C, M2 macrophage count expressed as percentage of total macrophage count. D, M1 to M2 ratio. n = 8/experimental group; two-way ANOVA: *, P < .01 IH-Veh vs 3 other treatment groups; #, IH-Resv vs RA groups.

