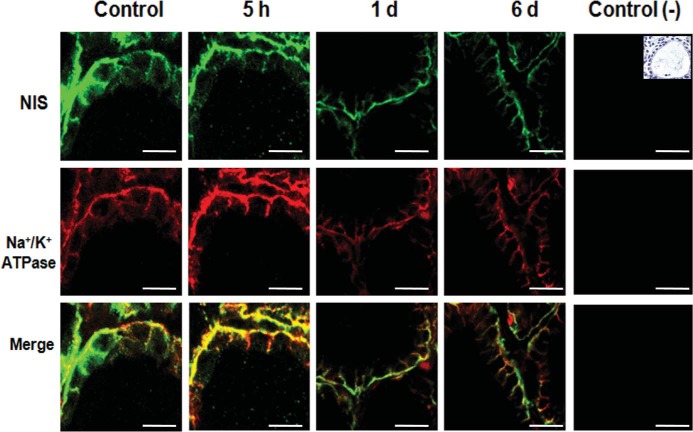
Figure 3. NIS localization was unaltered after excess I−.
Representative photographs of confocal immunofluorescence microscopy analysis of NIS and Na+/K+ ATPase localization in the thyroid glands of male rats (n = 3) that received excess I− (100 μg/d) for 5 hours, 1 day, or 6 days are shown. NIS is visualized in green, whereas the α1-subunit of Na+/K+ ATPase, a plasma membrane marker, is visualized in red. Colocalization of the NIS with the α1-subunit of Na+/K+ ATPase is visualized in yellow. The white bar corresponds to 20 μm. The negative control corresponded to immunofluorescence of only the secondary antibodies used for NIS and the α1-subunit of the Na+/K+ ATPase. A picture with hematoxylin-eosin stain was included as a reference to show thyroid follicle structure in a control animal.

