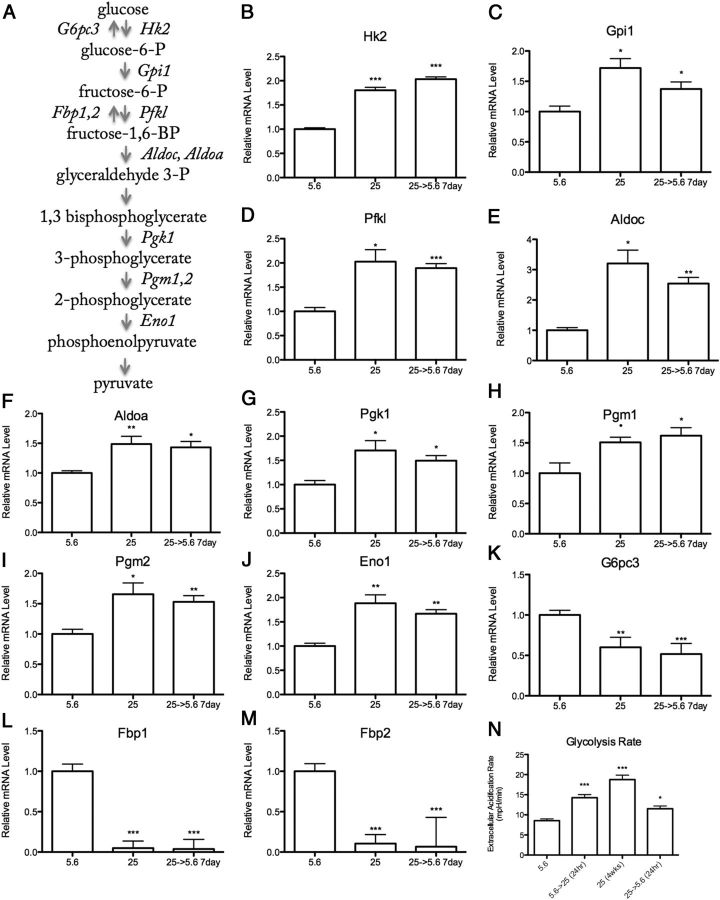
Figure 1.
Chronic (>8 wk) 25 mM High Glucose Increases Glycolysis in IMS32 Schwann Cells. A, Schematic diagram of glycolysis. Enzymes that promote glycolysis (italicized right of arrow) and those that oppose glycolysis (italicized left of arrow) are regulated by chronic high glucose in Schwann cells (full gene names listed in Table 1). mRNA levels of proglycolytic (B–J) and antiglycolytic (K–M) enzymes during normal (5.6 mM), chronic (>8 wk) high (25 mM), and chronic high returned to normal glucose conditions. N, Glycolysis rate as measured by extracellular acidification rate of 5.6 mM glucose, 25 mM glucose for 24 hours, 4 weeks, and 4 weeks high glucose returned to normal for 24 hours. Data are represented as mean ± SEM. Asterisks indicate significance by Dunnett's post hoc test compared with the 5.6 mM glucose control group. *, P < .05; **, P < .01; ***, P < .001. mRNA levels are expressed relative to normal glucose following normalization with HK genes Gusb, Hprt1, and Hsp90ab1.

