
Figure 2.
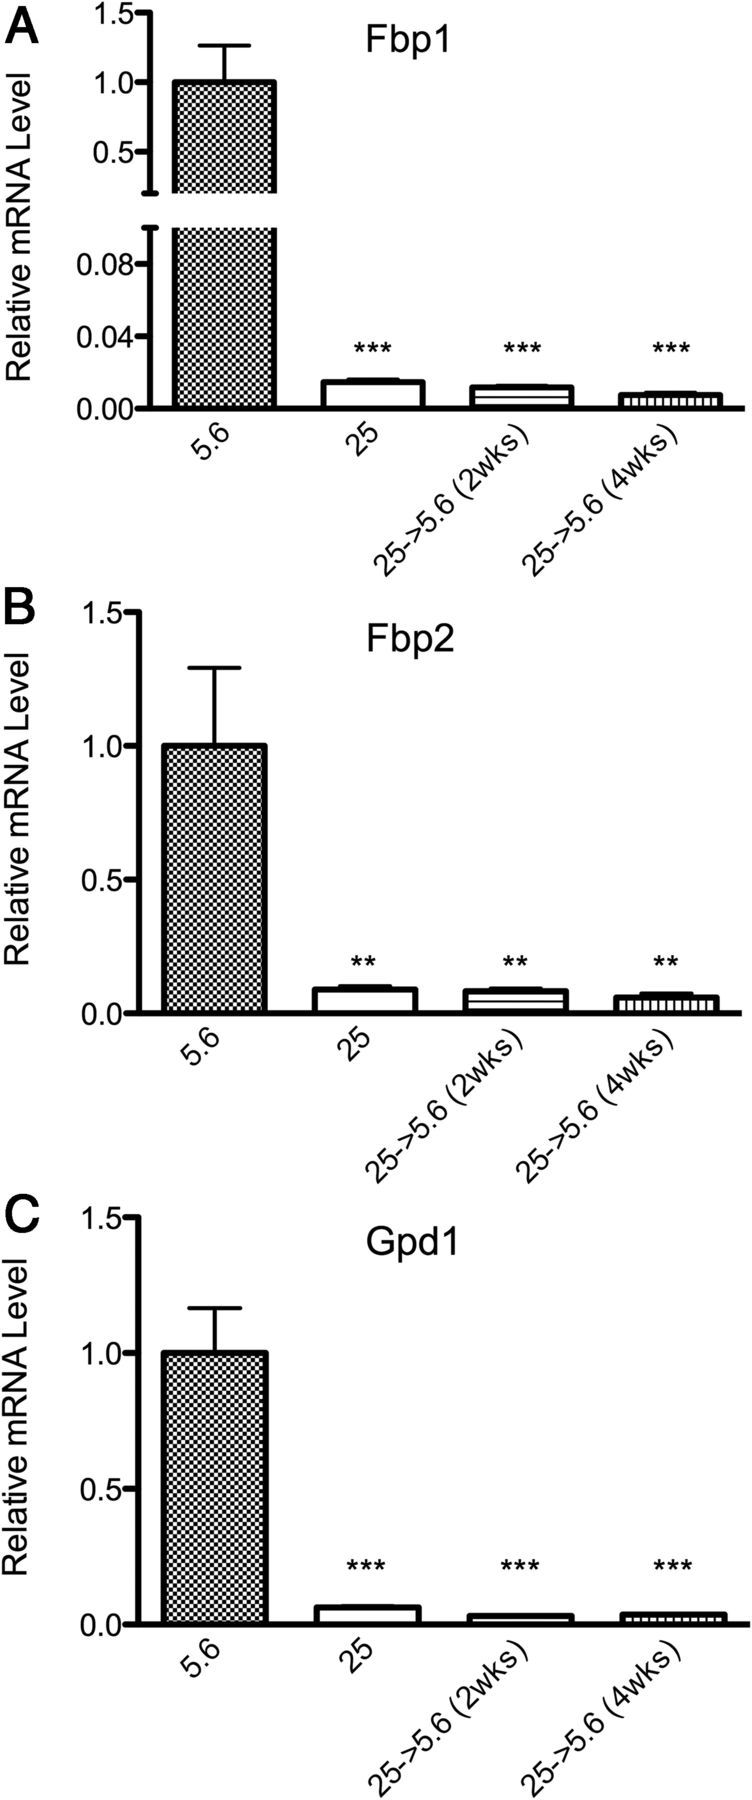
Persistence of Glucose-Induced Gene Memory. A–C, Expression of Fbp1, Fbp2, and Gpd1 at 5.6 mM normal glucose, chronic (>8 wk) 25 mM high glucose, and upon return to 5.6 mM normal glucose for 2 and 4 weeks. Data are represented as mean ± SEM. Asterisks indicate significance by Dunnett's post hoc test compared with the 5.6 mM glucose control group. *, P < .05; **, P < .01; ***, P < .001. mRNA levels are expressed relative to normal glucose after normalization with HK genes Ppib and Hprt1.