
Figure 4.
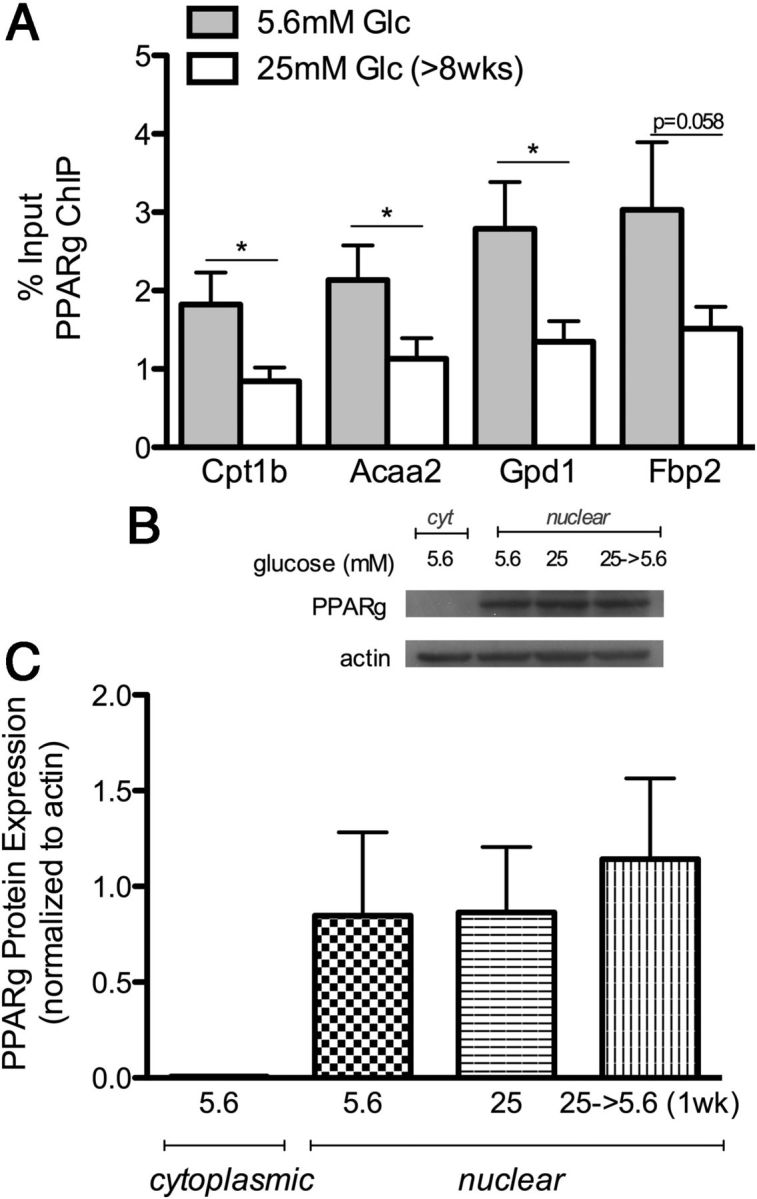
PPARγ ChIP and Protein Expression. A, Schwann cells maintained at 25 mM high glucose (>8 wk) exhibit decreased PPARγ binding to the promoter of Cpt1b, Acaa2, Gpd1, and Fbp2 using chromatin immunoprecipitation. Data are shown as percent input, which represents the DNA sequence enriched by immunoprecipitation with PPARγ antibody normalized to input DNA (n = 8). Student's t test compares 5.6 vs 25 mM glucose (*, P < .05). B, Representative Western blot of PPARγ in the cytoplasmic and nuclear fraction at 5.6 mM glucose, chronic (>8 wk) 25 mM glucose, and after return to 5.6 mM glucose for 1 week. C, Quantification of PPARγ protein levels normalized to actin levels. Data represented as mean ± SEM (n = 3).