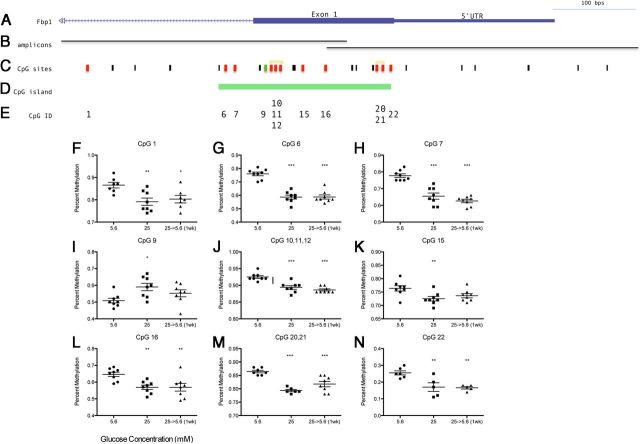
Figure 6.
DNA Methylation of Fbp1 after Exposure to 25 mM High Glucose (>8 wk) and after Normalization (5.6 mM) for 1 Week. Location of (A) Fbp1 relative to (B) amplicon regions assayed, (C) CpG sites, and (D) CpG island of Fbp1 using UCSC Genome Browser (http:/genome.ucsc.edu/). Black bars indicate individual CpG sites, red bars indicate decreased methylation following high glucose, and green bars indicate increased methylation. F–N, Percent methylation was obtained for each CpG assayed, location corresponding to CpG ID (E), (n = 8), mean ± SEM. one-way ANOVA followed by Dunnett's Multiple Comparison Test compared with 5.6 mM control; *, P < .05; **, P < .01; ***, P < .001. Data for CpG sites within the same fragment after cleavage reactions are shown together (yellow bracket in C) because data for these sites fails to be uniquely informative.

