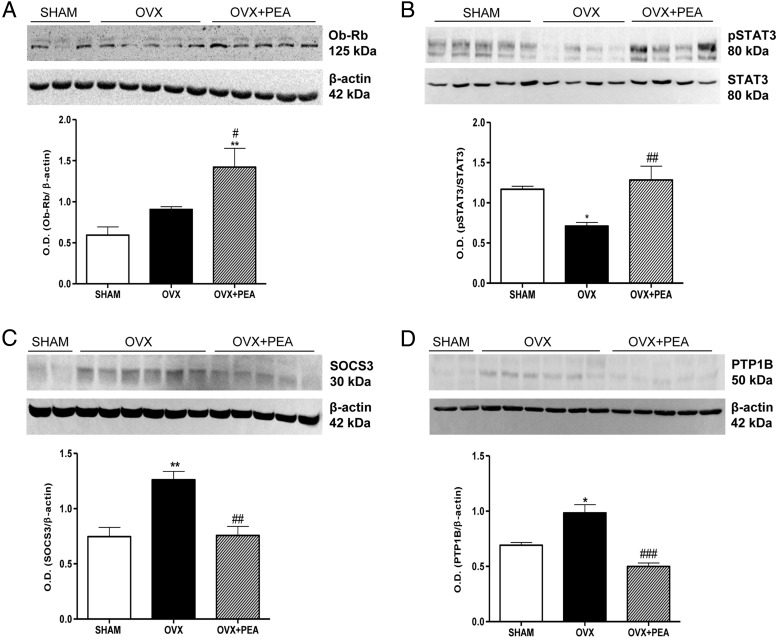
Figure 2.
Changes in Ob-Rb (A), pSTAT3 (B), SOCS3 (C), and PTP1B (D) expression in hypothalamus obtained from SHAM, OVX, and OVX+PEA groups. These are representative blots of tissue lysates obtained from 6 animals in each group. Densitometric analysis performed for all groups is shown. *, P < .05 and **, P < .01 vs SHAM; #, P < .05; ##, P < .01; and ###, P < .001 vs OVX.

