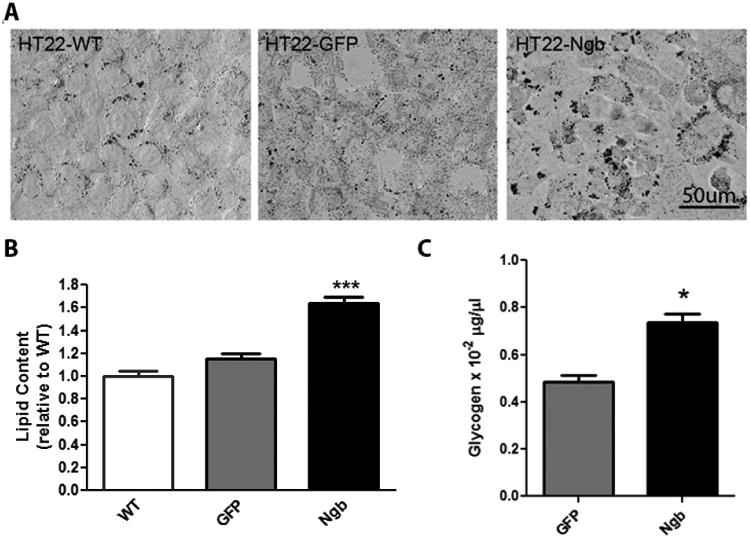
Fig. 5. Ngb overexpression increases lipid and glycogen content in HT-22 cells.

A. Representative oil red O staining showed that Ngb overexpression increased lipid content in HT22-Ngb compared with HT22-WT and HT22-GFP cells (controls). B. Quantitative lipid analysis demonstrated that lipid content in HT22-Ngb cells was higher than that in HT22-WT and HT22-GFP cells. C. Quantitative glycogen analysis demonstrated that glycogen content was increased in HT22-Ngb cells. * p < 0.05.
