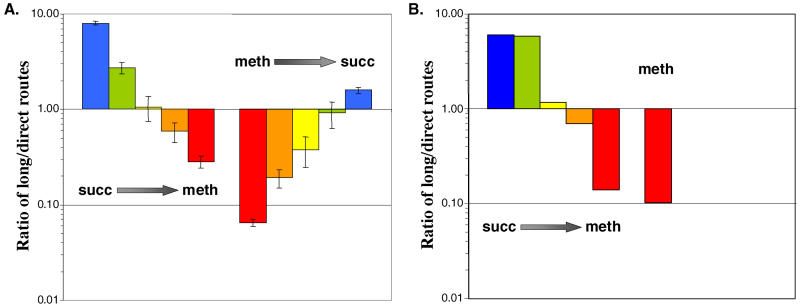
Figure 3. Change in Ratio of Flux through Long Versus Direct Methylene-H4F Formation Routes during Growth Transitions.
(A) Experimental data as determined by GC–MS analysis of serine isotopomers. The bars for each transition represent a time series from cells harvested 1 h prior to the transition, and four time points following the transition (succinate to methanol: 1, 5, 7.5, and 10 h; methanol to succinate: 1, 3, 5, and 7 h).
(B) Predictions based on kinetic model simulations. The bars indicate the succinate to methanol transition (same time points as for the experimental data) and the methanol steady-state prediction.

