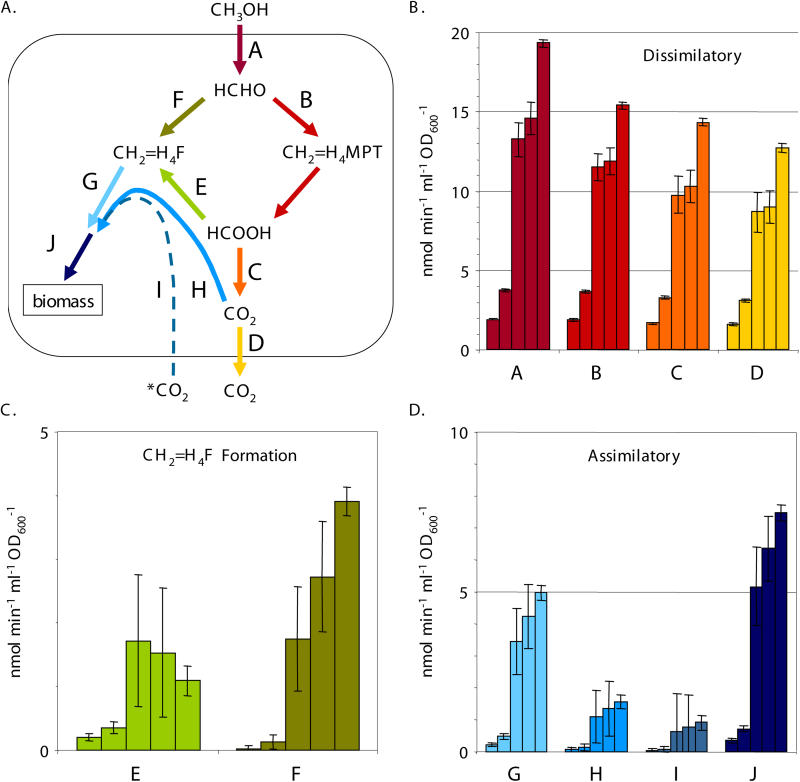
Figure 4. C1 Fluxes during Transition from Succinate to Methanol.
The fluxes determined are represented schematically (A). The other panels present flux for each branch, labeled A through J. The five bars for each flux represent a time series from cells harvested 1 h prior to the transition from succinate to methanol, and 1, 5, 7.5, and 10 h after the switch. Dissimilatory (B), methylene-H4F formation (C), and assimilatory (D) fluxes are presented separately with different scales for clarity. Flux F represents maximum fluxes.

