

Summary
BET (bromodomain and extraterminal motif) proteins are pharmacologic targets for the treatment of diverse diseases, yet the roles of individual BET family members remain unclear. We find that BRD2 but not BRD4 colocalizes with the architectural/insulator protein CCCTC-binding factor (CTCF) genome-wide. CTCF recruits BRD2 to co-bound sites, whereas BRD2 is dispensable for CTCF occupancy. Disruption of a CTCF/BRD2-occupied element positioned between two unrelated genes enables regulatory influence to spread from one gene to another, suggesting that CTCF and BRD2 form a transcriptional boundary. Accordingly, single molecule mRNA FISH reveals that upon site-specific CTCF disruption or BRD2 depletion, expression of the two genes becomes increasingly correlated. HiC shows that BRD2 depletion weakens boundaries co-occupied by CTCF and BRD2, but not those that lack BRD2. These findings indicate that BRD2 supports boundary activity and raise the possibility that pharmacologic BET inhibitors can influence gene expression in part by perturbing domain boundary function.
Keywords: BET proteins, BRD2, CTCF, transcription, chromatin architecture
Graphical abstract

Introduction
BRD2, BRD3, and BRD4 are members of the bromodomain and extraterminal motif (BET) family of proteins that are critical regulators of transcription. BET inhibitors that competitively target the bromodomain-acetyl lysine interaction have shown great promise in treating cancer and other pathologies and are currently in clinical development. However, much of how BET proteins function remains to be explored. BET proteins are ubiquitously expressed and bind to chromatin via bromodomain association with acetylated histones and/or transcription factors. A leading model is that BET proteins serve as general adaptors that recruit regulatory proteins to chromatin; however, BET inhibition does not result in global, but rather targeted and context-dependent effects on gene expression. Such selective sensitivity to BET inhibition has been attributed to BET protein occupancy at enhancers (Lovén et al., 2013), and recruitment by lineage-specific transcription factors (Asangani et al., 2015; Huang et al., 2009; Lamonica et al., 2011; Roe et al., 2015; Stonestrom et al., 2015). However, since most BET inhibitors indiscriminately target all family members (Filippakopoulos et al., 2010), the degree to which BRD2, BRD3, and BRD4 function with distinct regulatory complexes or play unique roles in gene regulation has not been well-characterized. Most studies have focused on BRD4 as the primary transcriptional effector, yet several reports have also identified roles for BRD2 in transcriptional activation (Belkina et al., 2013; Stonestrom et al., 2015; Surface et al., 2016; Vardabasso et al., 2015). How BRD2 functions distinctly from BRD3 and BRD4 remains largely unclear.
Several studies point to a role for BET proteins in both large-scale nuclear structure and chromatin organization. The testes-specific BET, BRDT, is required to maintain centromeric heterochromatin foci during spermatogenesis (Berkovits and Wolgemuth, 2011; Shang et al., 2007), while BRD4 has been linked to regulating both global (Devaiah et al., 2016; Wang et al., 2012) and gene-specific (Zhao et al., 2011) chromatin compaction. Notably, the yeast BET protein Bdf1 maintains heterochromatin-euchromatin boundaries at telomeres and mating loci, suggesting that BETs can help assemble physical barriers (Ladurner et al., 2003). In addition, Fs(1)h, a Drosophila BET protein, forms complexes with multiple insulator proteins (Kellner et al., 2013). Fs(1)h binding increases upon heat shock, a stress that is accompanied by changes in 3-D genomic architecture (Li et al., 2015). Yet whether mammalian BETs also participate directly in insulator or architectural functions remains unclear.
In vertebrates, CCCTC-binding factor (CTCF) contributes to the partitioning of the genome into discrete globular structures termed topologically associating domains (TADs) (Dixon et al., 2012; Nora et al., 2012). TADs represent megabase-sized regions within which loci are more likely to interact with each other than with genomic segments that lie outside. A number of observations suggest that TADs constrain the activity of transcriptional regulatory elements. For example, in some cases genes within TADs exhibit more correlated expression patterns with each other than with genes in other domains (Flavahan et al., 2015; Nora et al., 2012), and enhancers typically exert their activity within TAD boundaries (Symmons et al., 2014). CTCF was initially implicated in the formation of TAD structures due to its strong enrichment at TAD boundaries (Dixon et al., 2012). Upon deletion of a CTCF site at a TAD boundary, Narendra et al. observed the spreading of positive regulatory influence across the boundary and upregulation of previously inactive genes. Global depletion of CTCF increases genomic contacts across domain boundaries (Zuin et al., 2014). Mutations that abrogate CTCF binding at specific boundaries enable ectopic enhancer-promoter contacts between adjacent architectural domains, leading to aberrant gene activation in models of cancer and limb malformation (Flavahan et al., 2015; Lupiáñez et al., 2015). Taken together, these observations suggest that CTCF both functionally and physically divides the genome into structural domains. However, because the majority of CTCF-bound sites are not associated with TAD boundaries (Dixon et al., 2012; Phillips-Cremins et al., 2013), the context and mechanisms by which CTCF performs its insulating or boundary function at select sites is unknown.
Here we show that the BET protein BRD2 colocalizes with CTCF genome-wide. CTCF is required to recruit BRD2 to co-occupied sites, while CTCF binding is largely BRD2-independent. We present evidence that CTCF forms a functional boundary at the Mitoferrin 1 (Slc25a37) locus by restricting the activity of the Slc25a37 enhancer to prevent aberrant upregulation of a nearby gene. Using single-molecule mRNA FISH we find that CTCF, in concert with BRD2, limits the correlation in expression of two genes flanking the boundary. HiC experiments show that BRD2 contributes to chromatin domain boundary function by limiting chromatin contacts across boundaries specifically occupied by BRD2, but not those lacking BRD2. These findings reveal BRD2 as a CTCF cofactor and suggest that BET proteins may impact transcription in part through regulating higher-order chromatin architecture.
Results
BRD2 colocalizes with CTCF genome-wide
BRD2 and BRD4 are each required for gene activation during erythroid maturation driven by the hematopoietic transcription factor GATA1 (Stonestrom et al., 2015). However, genome-wide analysis of BET localization patterns in the erythroblast cell line G1E-ER4 indicated they may promote erythroid maturation through distinct mechanisms. Specifically, in contrast to BRD3 and BRD4, BRD2 genome-wide chromatin occupancy does not significantly overlap with that of GATA1, leaving its mechanism of action unresolved (Stonestrom et al., 2015). We analyzed BRD2 occupancy patterns in greater depth in relation to ChIP-seq datasets in G1E-ER4 cells from our laboratory (Stonestrom et al., 2015) and from the Mouse ENCODE Consortium. G1E-ER4 cells lack endogenous GATA1 and instead express a fusion protein of GATA1 and the ligand-binding domain of the estrogen receptor. Addition of estradiol induces erythroid maturation and activates a red cell-specific gene expression program (Welch, 2004) (here we refer to the differentiated state as “induced” G1E-ER4 or +GATA1, and the undifferentiated state as “uninduced” G1E-ER4 or –GATA1). In induced cells we observed a striking overlap between BRD2 and the architectural protein CTCF (Figure 1A). Overexpression of HA-tagged BRD2 tended to produce broader signals, but displayed a similar pattern of CTCF colocalization. Ranking of CTCF peaks by signal intensity (MACS score) revealed a strong correlation with BRD2 occupancy (Figure 1B, Figure 1D). To a lesser extent BRD3 was also enriched at CTCF sites, possibly reflecting functional overlap between BRD2 and BRD3 (Stonestrom et al., 2015) (Figure 1B). We observed a similar pattern of BRD2 colocalization with CTCF in undifferentiated cells (Figure S1A, S1B). Analysis of DNA sequences under BRD2 peaks using the MEME suite (Machanick and Bailey, 2011) identified a CTCF consensus at 57% of BRD2 sites, supporting extensive BRD2-CTCF colocalization (Figure 1C).
Figure 1. High correlation of BRD2 and CTCF occupancy genome-wide.
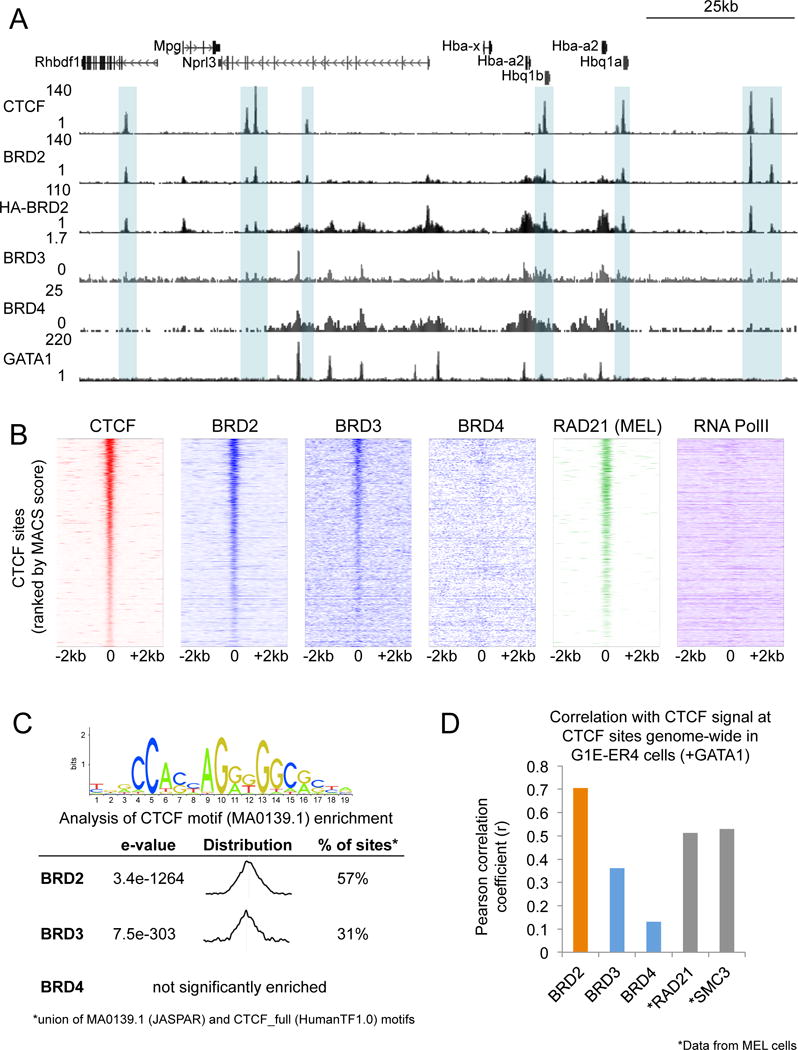
(A) Genome browser tracks showing ChIP-seq signal for CTCF, BRD2, HA-BRD2, BRD3, BRD4, and GATA1 at the α-globin (Hba) locus. Gray boxes highlight regions of BRD2/CTCF colocalization. All tracks shown are in the estradiol-induced (+GATA1) condition. (B) ChIP-seq signal for the indicated proteins in a 4kb window centered on CTCF binding sites in induced G1E-ER4 cells. Each row represents a single peak, ranked from highest to lowest CTCF signal (MACS score). (C) CTCF motif enrichment analysis using the MEME suite, performed on BRD2, BRD3, or BRD4 occupied sites in induced G1E-ER4 cells. The percent of sites containing a CTCF consensus motif (union of both the MA0139.1 (JASPAR) and CTCF_full (HumanTF1.0) motifs), as well as the distribution of the motif relative to the BET protein peak are indicated. (D) Pearson correlation coefficients between CTCF (RPKM) and indicated proteins (RPKM) at CTCF binding sites. RAD21 and SMC3 ChIP-seq data are from ENCODE datasets in MEL cells. See also Figure S1.
Among the known CTCF binding partners, the cohesin complex in particular occupies a large fraction of CTCF sites in diverse cell types, and participates in CTCF-mediated insulator function (Parelho et al., 2008; Wendt et al., 2008) and loop formation (Seitan et al., 2013; Sofueva et al., 2013). Using ChIP-seq datasets from the Mouse ENCODE Consortium in MEL cells, a related murine erythroid cell line, we found that the occupancy of cohesin subunits RAD21 and SMC3 is highly correlated with CTCF at CTCF-occupied sites in induced G1E-ER4 cells consistent with their established functional relationship (Figure 1D). The correlation between BRD2 and CTCF binding was similar to that observed between cohesin and CTCF, despite possible cell line-specific differences between MEL and G1E-ER4, suggesting that BRD2 may play a similarly important role in mediating CTCF function. At CTCF sites, BRD2 and cohesin also exhibit a strong correlation (Figures 1B, S1C), suggesting that many CTCF sites are occupied by both BRD2 and cohesin. Even though CTCF and BRD2 can associate with RNA Polymerase II (Pol II) (Chernukhin et al., 2007; Denis et al., 2006), this shared property does not account for their colocalization, as there is little overlap between Pol II (datasets from (Hsiung et al., 2016)) and BRD2 occupancy patterns at CTCF-occupied sites (Figures 1B, S1B).
Consistent with previous reports (Anders et al., 2013), we also noted some places, such as the α-globin genes (Hba), at which BRD2, BRD3, and BRD4 were all bound (Figure 1A). However, BRD4 was not highly enriched at CTCF sites genome-wide (Figure 1B), and did not correlate well with CTCF occupancy (Figure 1D), pointing to possible unique functional roles for BRD2 and BRD4.
CTCF is required for BRD2 occupancy at co-bound sites
The significant co-occupancy of BRD2 and CTCF suggests they may facilitate each other’s association with chromatin, similar to what has been described for BET proteins in the context of GATA1 or the androgen receptor (Asangani et al., 2015; Lamonica et al., 2011; Stonestrom et al., 2015). To test if BRD2 promotes CTCF binding, we performed ChIP-seq of CTCF in two independent G1E-ER4 clonal sub-lines in which BRD2 was depleted by CRISPR/Cas9 (BRD2 KO cell lines #1 and #2, Figure S2A), and unedited “control” G1E-ER4 cells. CTCF occupancy was unchanged at the majority of sites examined, including the α-globin locus (Figure 2A). When we compared CTCF signal intensities in control and BRD2-depleted cells genome-wide (Figure 2B), we found they were very similar among the two BRD2 KO cell lines and control cells (Pearson correlation coefficients: BRD2 KO #1 vs. BRD2 KO #2 = 0.84; Control vs. BRD2 KO #1 = 0.73; Control vs. BRD2 KO #2 = 0.73) (Figure 2B), indicating that CTCF chromatin occupancy is largely BRD2-independent. These results were confirmed using ChIP-qPCR at select CTCF sites (Figure S2B). Given that cohesin is present at many CTCF/BRD2 co-occupied sites, we tested whether BRD2 is required for cohesin recruitment at CTCF sites. ChIP-qPCR using antibodies against the cohesin subunit SMC1 showed that its occupancy was unaffected by BRD2 depletion at the majority of CTCF/BRD2 sites examined (Figure S2C), suggesting that BRD2 is dispensable for cohesin binding at CTCF sites.
Figure 2. CTCF recruits BRD2.

(A) Genome browser tracks showing CTCF ChIP-seq at the α-globin (Hba) locus in induced control G1E-ER4, and BRD2 KO #1 and #2 cells. (B) Scatter plot (binned 2D density plot) comparing CTCF ChIP-seq read density (RPKM) in control or BRD2 KO cells. Pearson correlation coefficients are indicated in each panel. The color scale represents the density of data points within each bin. (C) CRISPR-Cas9 mediated mutation of the CTCF binding site upstream of the Bcl11a gene. The mutant sequence creates an NdeI site. Blue and red nucleotides annotate the intact and mutant CTCF motifs, respectively. The guide RNA (gRNA) target sequence is also shown, along with sequence traces of both control cells and a mutant clone (Bcl11a-CTCF_Mut). (D) ChIP-qPCR of CTCF (left) and BRD2 (right) in control or Bcl11a-CTCF_Mut cells (all + GATA1). Bcl11a-28 #1 and #2 indicate two independent primer pairs to the region surrounding the mutated CTCF site (error bars represent SD, n=2). See also Figure S2.
BET proteins are recruited by transcription factors in diverse contexts (Asangani et al., 2015; Huang et al., 2009; Lamonica et al., 2011; Roe et al., 2015; Shi et al., 2014; Stonestrom et al., 2015; Wu et al., 2013). To determine if BRD2 requires CTCF to occupy chromatin, we used CRISPR/Cas9-mediated homology-directed repair to mutate a specific CTCF site upstream of the Bcl11a locus (Figure 2C). We introduced nine point mutations in the CTCF consensus sequence (Bcl11a-CTCF_Mut) that create a NdeI restriction site previously shown to eliminate CTCF binding in vitro (Szabo et al., 2004). This approach avoids the confounding effects of larger deletions or insertions that may further alter the structure of the locus. As predicted, these mutations abrogated CTCF binding in vivo (Figure 2D). ChIP-qPCR revealed that BRD2 occupancy was lost in the absence of CTCF at this site, but not at control regions where CTCF binding remained intact (Figure 2D). The expression of the surrounding genes was unaffected (Figure S2D), indicating that loss of BRD2 at this site was not a result of transcriptional changes at the locus. In sum, these data indicate that CTCF mediates BRD2 chromatin association but not vice versa.
CTCF defines a functional boundary at the Slc25a37 locus
CTCF has diverse roles in transcriptional regulation, including gene activation and repression, enhancer blocking, splicing, and forging long-range chromatin interactions (Phillips and Corces, 2009). To determine if BRD2 participates in any of these CTCF functions, we first perturbed CTCF in a locus-and site-specific manner. We focused on the Slc25a37 locus, or Mitoferrin 1, which contains a gene encoding a mitochondrial iron transporter required for erythroid maturation (Shaw et al., 2006). Three GATA1-occupied regulatory regions downstream of the Slc25a37 gene function as enhancer elements and are in physical proximity with the Slc25a37 promoter (Huang et al., 2016; Hughes et al., 2014). Two CTCF sites (CTCFa and CTCFb, Figure 3A) separate the enhancer from a neighboring gene, Entpd4, suggesting they may function as boundary or insulator elements to prevent the enhancer from inappropriately regulating Entpd4. Consistent with this possibility, chromatin interactions with the Slc25a37 promoter drop off significantly at these CTCF sites in Capture-C experiments (Hughes et al., 2014) (Figure S3A), and disruption of the GATA1-dependent enhancer elements reduces Slc25a37 expression but has no effect on the expression of Entpd4 (Huang et al., 2016). BRD2 colocalizes with CTCF at both CTCFa and CTCFb (Figure 3A).
Figure 3. CTCF supports a boundary at the Slc25a37 locus.

(A) Genome browser tracks of the indicated proteins at the Mitoferrin 1 (Slc25a37) locus in induced G1E-ER4 cells. Blue box: GATA1-dependent Slc25a37 enhancer; green box: CTCFa and CTCFb sites co-occupied by BRD2. Arrowheads below show orientation of the CTCF motifs. (B) ChIP-qPCR of CTCF and HA-BRD2 in control induced G1E-ER4 cells and Slc25a37-CTCFa_Mut#1 and Mut#2 cells (error bars: SEM, n=3). The CD4 gene serves as a negative control. (C) RT-qPCR of indicated transcripts in either uninduced (−GATA1) or GATA1-induced (+GATA1) cells. Transcripts were normalized to Gapdh (error bars represent SEM, n=3). See also Figures S3 and S4.
Using CRISPR/Cas9 we generated two independent clones with either biallelic deletions or combined deletions/insertions disrupting all or part of the CTCFa consensus sequence, Slc25a37-CTCFa_Mut#1 and Mut#2 (Figure S3B). ChIP-qPCR confirmed loss of occupancy by both CTCF and an HA-tagged form of BRD2 (Figure 3B). CTCF and HA-BRD2 binding at the second site, CTCFb, were unaffected by these mutations (Figure S3C). Attempts to mutate both CTCFa and CTCFb failed for unknown reasons. To examine the transcriptional consequences of disrupting CTCFa, we measured the expression of the surrounding genes. Slc25a37 levels changed little, if at all, in both clones. However, the expression of Entpd4 was upregulated ~3-fold (Figured 3C). Notably the increase in Entpd4 expression was GATA1-dependent, suggesting it results from inappropriate activation by the GATA1-regulated Slc25a37 enhancer. Other genes normally activated during erythroid maturation were unaffected (Figure S3D). These results are consistent with a role for CTCF in enhancer blocking or boundary formation.
To directly test whether CTCF restricts the Slc25a37 enhancer from contacting the Entpd4 gene, we performed chromosome conformation capture (3C). Both Slc25a37-CTCFa mutant cell lines exhibited increased interaction frequency between the Slc25a37 enhancer and the Entpd4 promoter (Figure S4B), indicating that CTCF serves to block enhancer contacts at this locus. One mechanism by which CTCF may perform its insulating function is through the pairing with other convergently oriented CTCF sites that demarcate a given contact domain (de Wit et al., 2015; Guo et al., 2015; Rao et al., 2014). The CTCFa and CTCFb motifs are both oriented in the reverse (left) direction (Figure 3A), suggesting their loop orientation is similar. We speculate that the effect sizes of inappropriate upregulation of Entpd4 expression and contacts with the Slc25a37 enhancer would have been greater had we been able to disrupt both CTCF sites simultaneously, similar to what has been observed at the Hox gene clusters (Narendra et al., 2015).
A direct test of BRD2’s role in the function of this boundary is hampered by the lack of a means to perturb BRD2 binding in a site-specific fashion. Global BRD2 depletion reduced expression of Slc25a37 (Figure S4A), likely due to BRD2 enrichment at the Slc25a37 promoter and enhancer (Figure 3A). Moreover, the Slc25a37 enhancer-promoter contacts were diminished in the absence of BRD2 as measured by 3C (Figure S4C), indicating that the Slc25a37 enhancer requires BRD2 for its full activity. The weakening of the Slc25a37 enhancer in the absence of BRD2 complicates the assessment of whether BRD2, similar to CTCF, limits the range of Slc25a37 enhancer activity. Using 3C we observed a subtle trend toward increased contacts between the Slc25a37 enhancer and the Entpd4 promoter upon BRD2 loss, but it did not reach statistical significance (Figure S4C). It is possible that direct or indirect effects from BRD2 depletion obscure potential increases in both Entpd4 levels and contacts between the Slc25a37 enhancer and Entpd4 promoter. Hence, we pursued an independent strategy to detect perturbed boundary strength by examining the degree of correlation in expression of genes flanking the boundary as described in the following section.
BRD2 potentiates CTCF boundary function in single cells
Loss of the Slc25a37-CTCFa site renders Entpd4 GATA1-responsive and increases contacts between the Slc25a37 enhancer and Entpd4, suggesting that the two genes now share the regulatory influence of this enhancer. To test whether Slc25a37 and Entpd4 are coregulated in the absence of CTCFa, we examined their expression in individual cells by quantitative single-molecule mRNA FISH (Femino et al., 1998; Raj et al., 2008). This method is based on the use of fluorescent probes targeting exons and allows the counting of individual Slc25a37 and Entpd4 mRNAs. The absolute mRNA counts of Slc25a37 and Entpd4 reflected gene expression changes observed in bulk populations (Figure S5A), with cells from both Slc25a37-CTCFa mutated lines exhibiting elevated Entpd4 levels compared to control cells, and the levels of Slc25a37 remaining unchanged. We next assessed the correlation in mRNA levels in single cells, as depicted in the model shown in Figure 4A. A low correlation suggests that Slc25a37 and Entpd4 have little regulatory relationship, while a high correlation implies that the two genes share regulatory control. We note that such a relationship cannot be observed in bulk mRNA measurements in which, for example, two cell populations could have equal total mRNA levels of two genes but exhibit distinct levels of each transcript in individual cells (as illustrated in Figure 4A). To test this we plotted the number of mRNA molecules per cell of each gene from either control or Slc25a37-CTCFa mutant populations and measured the correlation coefficient across three biological replicates (Figures 4B–D). In control cells, expression of Slc25a37 and Entpd4 exhibited a low level of correlation. Deletion of the intervening CTCFa site significantly increased their correlation (Figures 4B–D) in both Slc25a37-CTCFa mutant lines.
Figure 4. CTCF and BRD2 maintain the integrity of a transcriptional boundary in single cells.
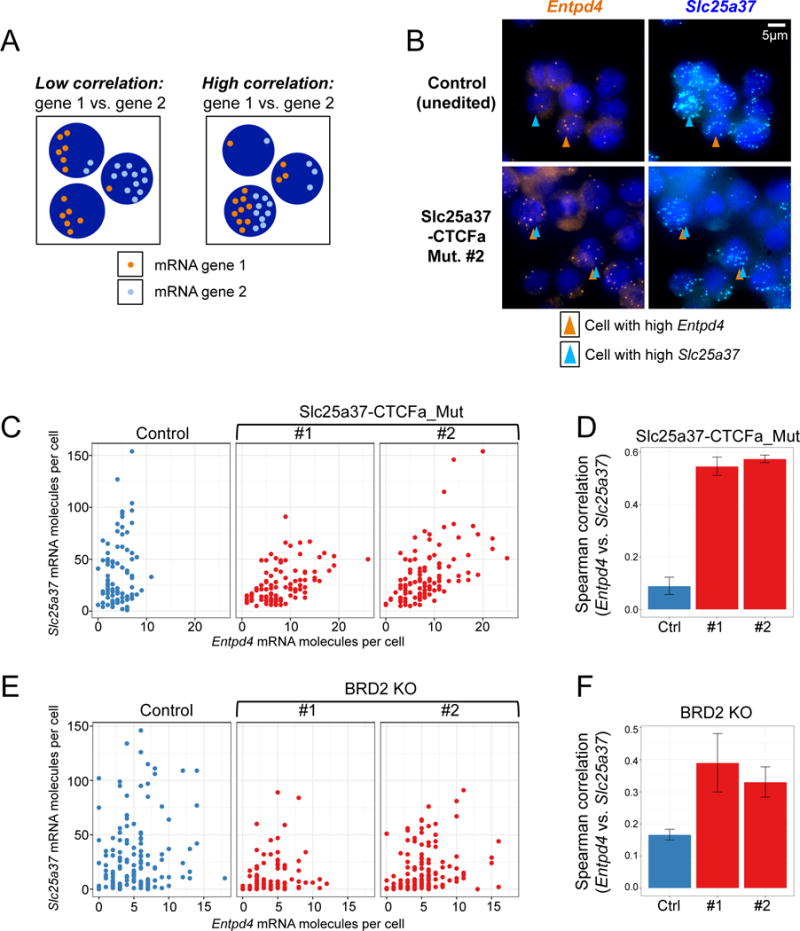
(A) Model illustrating scenarios in which two genes exhibit either low (left) or high (right) correlation on a per cell basis. (B) Single-molecule RNA FISH using probes to exons in either Slc25a37 or Entpd4 in induced control or boundary-mutated Slc25a37-CTCFa_Mut cells. Each spot represents a single mRNA molecule. Arrows indicate cells with high levels of either Slc25a37 or Entpd4 mRNA. (C) Scatter plots of a representative experiment showing Slc25a37 and Entpd4 mRNA counts per cell in control and both Slc25a37-CTCFa_Mut cell lines. (D) Average Spearman correlations of Slc25a37 and Entpd4 transcripts from three biological replicates of control or Slc25a37-CTCFa_Mut cell lines #1 and #2 (n=3, error bars: SEM) (E) Scatter plots of a representative experiment for induced control or BRD2 KO #1 and #2 cells. (F) Average Spearman correlations of Slc25a37 and Entpd4 quantified over four biological replicates in control or BRD2 KO #1 and #2 cells (n=4, error bars: SEM). See also Figure S5.
We considered that the observed changes in correlated gene expression could result from other confounding factors. For example, assume that two genes have equal transcription rates in every cell, but that this rate varies from cell to cell. At high transcript levels, a strong correlation between transcript counts would be observed. However, at low transcript abundances, the effects of random counting noise would play a disproportionate role, resulting in a decreased observed correlation despite the exact equivalence in transcription rate in every cell. In the present case, Entpd4 expression is lower in control cells, raising the possibility that a potential correlation with Slc25a37 expression is masked due to low molecule number noise. To test this possibility, we scaled down the levels of Entpd4 in the Slc25a37-CTCFa-mutated lines such that the means of control and mutant populations were equivalent. We then added random sampling error to the number of Entpd4 mRNA molecules, thus mimicking counting errors at low expression levels. We found that while some of the increased correlation in the mutant can be explained this way, the difference in correlation between the Slc25a37-CTCFa mutant and control populations remained intact (Figure S5B). To increase the analytical stringency, we scaled the levels of Entpd4 in the Slc25a37-CTCFa mutated lines down to half that of control levels. While the correlation in the Slc25a37-CTCFa mutated cells decreased further, it still remained higher than in the control setting (unpublished observation).
Transcript abundance can correlate with cell size (Padovan-Merhar et al., 2015). To control for possible effects of cell size differences between populations, we normalized Entpd4 mRNA levels to cell area, and measured the correlation between Slc25a37 and Entpd4. The correlation between these two genes in the boundary-mutated cells remained higher, demonstrating that possible cell size differences are not a main contributing factor (Figure S5C). In concert, these results further support that CTCF prevents the Slc25a37 enhancer from acting on the Entpd4 gene.
To test whether BRD2 participates in CTCF’s boundary function at this locus, we performed mRNA FISH on BRD2-depleted cells (Figure 4E). Absolute mRNA measurements of Slc25a37 and Entpd4 were consistent with RT-qPCR analysis (Figures S4A, S5D). Notably, in both BRD2-deficient clones the two genes displayed an increased correlation in their expression (Figures 4E and 4F) relative to control cells. In comparing the difference between correlation coefficients, we find that one BRD2-depleted clone reached statistical significance relative to control cells (BRD2 KO#2, p=0.018 (t-test)), while the other showed the same trend but fell short of statistical significance (BRD2 KO#1, p=0.069 (t-test)). Within each of the four biological replicates of this experiment we note that, with one exception, the correlation between the two genes was increased in the BRD2-depleted clones relative to control cells (Figure S5E). While we included all replicates in our pooled comparisons, thus explaining why there is some degree of variability in the data, the consistency of the trend within the majority of experiments supports that the two genes are indeed more correlated in the absence of BRD2. The increased correlation in BRD2-depleted cells remained intact after normalizing for cell area (Figure S5C). We note that performing a similar simulation as described above, in this case scaling down the levels of Slc25a37 in control cells such that the means of control and BRD2 KO populations were equivalent, did not significantly alter the results (unpublished observation), suggesting that changes in overall transcript abundances are not driving the differences in correlation we observe.
While we cannot rule out potentially confounding secondary effects from sustained BRD2 depletion, these results suggest that BRD2 supports CTCF’s ability to partition transcriptional regulatory elements at this locus.
Loss of BRD2 weakens BRD2-occupied boundaries
CTCF’s function as an insulating or boundary element may be linked to its role in organizing genome architecture. To assess whether BRD2 regulates chromatin structure, and whether this function overlaps with that of CTCF, we generated 40kb-resolution in situ HiC maps in control G1E-ER4 cells and two BRD2-depleted cell lines. Two biological replicates for each cellular condition generated a total of approximately 934 million unique interaction pairs (control: ~323 million, BRD2 KO#1: ~301 million, BRD2 KO#2: ~310 million) (Figure S6A, Table S1). Since BRD2 is required for erythroid differentiation, experiments were performed in uninduced cells (-GATA1) to avoid potentially confounding effects of differences in maturation. The raw reads from biological replicates were highly correlated with one another, demonstrating the reproducibility of the experiment and allowing us to merge the two replicates for all subsequent analysis. We corrected for inherent biases in HiC maps via matrix balancing, and visualized contact frequency heat maps binned at 40kb resolution. We used the Kit locus as a benchmark to determine whether our HiC data captured known structural features (Figure S6B). In the 2Mb region surrounding Kit, we observed domain structure highly similar to published HiC data in mESCs (Dixon et al., 2012) and CH12-LX cells (Rao et al., 2014). While the larger domain structure is similar between cell lines, cell-type specific differences surrounding Kit emerge at the sub-domain level (Figure S6B).
CTCF has been implicated in the formation and maintenance of architectural domain boundaries. To define such boundaries we computed the directionality index for each 40kb bin in the genome by comparing the bin’s interactions with the 50 bins (2Mb) immediately upstream and downstream. We then applied the Hidden Markov Model approach proposed by Ren and colleagues (Dixon et al., 2012) to call 1,814 domains (median size 920kb) in our control cells. Supporting the validity of this method, domain calls showed strong correlation with the visual representation of large-scale domain structure in the heat maps (Figures 5A, 5B, S6B). We note that these regions are likely comparable to megabase-scale TADs identified in published work (Dixon et al., 2012; Nora et al., 2012); however, we will refer to them as domains and domain boundaries for simplicity.
Figure 5. Effects of BRD2 depletion on boundary strength.

(A) Contact frequency heat maps at 40kb resolution of the Sec16b locus in control and BRD2 KO cells. Color bars range from low (white) to high (red) contact frequency. Black arrows point to areas of increased crossboundary interactions in BRD2 KO cells. All heat maps are framed by CTCF and BRD2 ChIP-seq tracks from control undifferentiated cells (−GATA1). (B) Contact frequency heat maps for the locus surrounding Ier5 with areas of increased interaction frequency indicated by arrows. (C) Top: cartoon illustrating boundary classifications. Below: histograms showing the distribution of insulation score changes at boundaries called at 40kb resolution, either between control cells and an average of the two BRD2 KO cell lines (top row, log2(averageBRD2 KO/control)), or between BRD2 KO #1 and BRD2 KO #2 (bottom row, log2(BRD2KO #1/BRD2KO #2)). The red line indicates no change. (D) Average insulation scores centered on boundaries called at 40kb resolution in control G1E-ER4 cells or either of the two BRD2 KO cell lines (#1 and #2) at the indicated boundary category (error bars: 2.5th and 97.5th percentile of the distribution of the sampling means). See also Figure S6, Tables S1–S5.
We next determined whether domain boundary structure was affected by BRD2 depletion. Contact maps uncovered a spectrum of structural perturbations at individual boundaries, with the most common being an increase in ectopic, short-range interactions across boundaries (Figures 5A and 5B), and a blurring of the transitions between domains, including rare but dramatic boundary disruptions (Figure S6C). To determine whether the TAD boundary disruption is associated with altered transcriptional regulation, we measured expression of the genes surrounding the boundaries in Figures 5A and S6C (Figure S6G). Some genes (Sec16b from the locus in Figure 5A, Xrcc4 from the locus in Figure S6C) were downregulated, while others were either unaffected (Rasal2, Tmem167), or increased (Ralgps2 from the Figure 5A locus) upon BRD2 depletion (Figure S6G). We note that we cannot distinguish whether the changes in chromatin structure causally underlie the changes in gene expression at these regions, nor can we rule out a role for BRD2 in regulating transcription independent of any architectural function. However, the observation that transcription can be upregulated suggests that domain perturbations might lead to enhancer miswiring across domains.
To measure the contributions of CTCF and BRD2 to boundary formation genome-wide, we classified boundaries by their BRD2 and CTCF occupancy within +/−20kb of the boundary position (Table S4). We called a set of high-confidence BRD2 and CTCF peaks in control G1E-ER4 cells and intersected these to find regions of the genome with high BRD2/CTCF occupancy. To distinguish sites uniquely occupied by either BRD2 or CTCF, we additionally called a set of low-confidence peaks and used these to rule out occupancy by the other factor. Boundaries were parsed into the following categories: (1) those with BRD2 without CTCF, (2) those in which CTCF and BRD2 are directly co-localized, with no additional CTCF-only or BRD2-only sites (“CTCF/BRD2 co-occupied only”), (3) those in which CTCF and BRD2 are directly co-localized with additional BRD2-only sites (“CTCF/BRD2 co-occupied with BRD2-only”), (4) those in which CTCF and BRD2 are directly co-localized with additional CTCF-only sites (“CTCF/BRD2 co-occupied with CTCF-only”), (5) those with CTCF without BRD2, and (6) those that lack either protein (“Neither”) (see Figure 5C, Tables S2 and S4). All boundaries containing multiple classes of colocalized sites and/or peaks that did not meet our stringent thresholds were classified as “Other” and were not included in the analysis. We validated this strategy by examining ChIP-seq peak enrichment in each category (Figure S6H). Our classification scheme suggests domain boundaries exhibit diverse signatures of BRD2 and CTCF occupancy.
To quantify changes in boundary strength upon BRD2 depletion, we computed the insulation score for every boundary within a given classification in control and BRD2 KO cells. The insulation score aggregates the number of interactions in a sliding window along the linear chromosome (Crane et al., 2015). A less well-insulated region – characterized by a high frequency of interactions passing over – would have a concomitantly high insulation score. A 5-by-5 bin (200kb-by-200kb) sliding window was used to quantify insulation scores across boundaries. The relative change (log2 scale) in insulation score for each boundary between control and BRD2 KO cells was plotted as a histogram for each boundary category (Figure 5C, top panels). We compared these to empiric null distributions created by computing the log2 fold changes in boundary insulation score between BRD2 KO#1 and BRD2 KO#2 cells (Figure 5C, bottom panels). When each category was examined individually, we observed an increase in insulation score (corresponding to a gain of interactions across the boundary) at boundary classes containing BRD2 (Figure 5C, Table S2). The boundaries most affected by BRD2 loss had CTCF/BRD2 co-occupied sites with additional BRD2-only sites. Effects were also present at boundaries containing BRD2 without CTCF, boundaries with CTCF/BRD2 co-occupied only sites, or CTCF/BRD2 co-occupied with CTCF only sites (Figure 5C, Table S2). Importantly, CTCF-only boundaries and boundaries devoid of CTCF and BRD2 were essentially unperturbed in the BRD2 KO cells, suggesting the effect is specific to BRD2-occupied regions. The shift in insulation score is mostly driven by relatively modest changes at a substantial proportion of BRD2/CTCF boundaries rather than large alterations at a small fraction (Figure 5C). These data indicate that BRD2 contributes to the demarcation of domain boundaries.
To better understand the link between BRD2 and higher-order chromatin architecture, we visualized the average insulation scores in each boundary category as line graphs in which boundaries appear as local minima. Again, the most perturbed boundaries in BRD2-depleted cells were those containing BRD2, as evidenced by an increase in insulation score (or interaction frequency) across boundaries. Boundaries lacking BRD2 remained intact (Figure 5D), suggesting that BRD2 potentiates domain boundary integrity. To ensure that our results were robust to the resolution of our HiC data, we also conducted our insulation score analyses at 10kb resolution (Tables S3 and S5) and observed very similar effects of BRD2 depletion on the shifts in insulation score (Figure S6D–F). Even at higher resolution we could still observe a substantial number of significantly weakened BRD2-occupied boundaries, whereas the impact on boundaries without BRD2 was negligible (Figure S6D–F, Table S3). We also observed that at both resolutions the strongest effects on insulation score tended to occur at domain boundaries.
We note that the datasets generated in this study will allow for much broader analyses of domain architecture, as well as intra-domain looping interactions at various length scales. Space constraints preclude us from presenting more permutations of the analyses but the datasets are publicly available for further study. Taken together our results indicate that BRD2 is required to maintain chromatin domain integrity and may operate through both CTCF-dependent and -independent mechanisms.
Discussion
Our work uncovers a functional link between the architectural protein CTCF and the BET protein BRD2 in large-scale chromatin organization. BRD2, and to a lesser extent BRD3, are colocalized with CTCF genome-wide. Loss of BRD2 is accompanied by widespread alterations in domain boundaries, characterized by an increase in ectopic cross-boundary chromatin contacts, particularly involving regions at which both BRD2 and CTCF are present. While BET proteins are well known for their ability to recruit transcriptional co-regulators to acetylated chromatin, a role in maintaining domain-level chromatin architecture has not previously been appreciated.
BET proteins can facilitate chromatin occupancy of DNA binding proteins (Lamonica et al., 2011) (Stonestrom et al., 2015), but CTCF binding occurs normally in the absence of BRD2, suggesting that BRD2 functions “downstream” of CTCF. However, given that BRD3 can also occupy CTCF sites, a compensatory role for BRD3 in aiding CTCF DNA binding remains possible. Indeed the yeast BET homolog Bdf2 responds to Bdf1 loss by shifting its occupancy to Bdf1 sites (Durant and Pugh, 2007).
BET proteins associate with chromatin not only via acetylated histones, but also acetylated transcription factors (Asangani et al., 2015; Huang et al., 2009; Lamonica et al., 2011; Roe et al., 2015; Shi et al., 2014). Whether the CTCF-BRD2 interaction is direct and whether it requires acetylation of CTCF or another CTCF cofactor remain open questions. Conventional co-immunoprecipitation experiments failed to detect an association between BRD2 and CTCF (unpublished observation), but it is possible that the interaction occurs in the context of chromatin or is sensitive to extraction conditions.
Disruption of one of two CTCF sites that normally separate the erythroid-specific gene Slc25a37 from its independently regulated neighbor Entpd4, enabled the activity of the GATA1-controlled Slc25a37 enhancer to inappropriately contact the Entpd4 promoter and activate Entpd4 expression in a GATA1-dependent fashion. Thus, at this site CTCF functions as part of a boundary mechanism that constrains enhancer action. Since BRD2 occupancy cannot be easily disrupted locally, we examined the activity of this boundary in BRD2-depleted cells. BRD2 deficiency does not augment Entpd4 expression and thus does not phenocopy the bulk transcriptional effects of the specific CTCF site mutation. However, the interpretation of this experiment is confounded by the reduced expression of Slc25a37 in BRD2-depleted cells and the decreased contacts between the Slc25a37 enhancer and Slc25a37 promoter, indicating the enhancer is less active in this context. Population-based gene expression studies are limited in that they might obscure transcriptional relationships that occur at the single cell level. We therefore used single molecule mRNA FISH to quantify the number of Slc25a37 and Entpd4 mRNA molecules per cell and measured their correlation. CTCF site mutation at the boundary as well as global BRD2 loss elevated the correlation in expression of both genes. Although global BRD2 loss could have indirect effects, such as the depletion of other factors involved in maintaining this boundary element, these observations suggest that in the absence of CTCF or BRD2 the genes share transcriptional regulatory mechanisms. This supports the model that BRD2 contributes to CTCF’s ability to limit enhancer activity and highlights the power of RNA FISH to probe correlative relationships of gene expression. The effect of BRD2 depletion on the Slc25a37/Entpd4 boundary was not as strong as that following disruption of CTCF. This might be due to partial compensation by BRD3, or to CTCF exerting some of its activity independently of BET proteins. Conversely, a fraction of BRD2-occupied sites lacks CTCF, indicating that BRD2 can also function in a CTCF-independent manner.
CTCF’s role as a boundary or insulator element may be related to its ability to organize higher-order chromatin architecture (Phillips and Corces, 2009). CTCF anchors long-range chromatin interactions (Phillips-Cremins et al., 2013), and its disruption increases inter-domain chromatin contacts (Narendra et al., 2015; Zuin et al., 2014). Our HiC analysis revealed that loss of BRD2 similarly increases contact frequencies across BRD2-occupied domain boundaries genome-wide, demonstrating that BRD2 globally contributes to domain insulation. The mechanism by which BRD2 functions in this context remains an open question. CTCF is thought to form chromatin loops, which might structurally partition the genome. BRD2 has a putative dimerization domain (Garcia-Gutierrez et al., 2012) that could aid in forging chromatin contacts. Alterations in chromatin interactions in BRD2-deficient cells were accompanied by changes in gene expression, suggesting at a correlative level that the relaxing of boundaries enables enhancer rewiring or enhancer promiscuity. However, given that these experiments involved sustained BRD2 depletion, it is also possible that the architectural changes are a corollary of disrupted transcription, or indirectly result from loss of factors involved in looping or insulation.
Previous reports suggested that BRD2, BRD3, and BRD4 bind to overlapping sets of transcriptional regulatory complexes (Dawson et al., 2011; Rahman et al., 2011), and exhibit significantly overlapping occupancy at active genes (Anders et al., 2013). Our study underscores key differences between the functions of individual BET family members by showing that in contrast to BRD2 and BRD3, BRD4 is not enriched at CTCF sites. Also, a prior study in erythroid cells found that BRD2, BRD3, and BRD4 exhibit distinct localization patterns in relation to the erythroid transcription factor GATA1, and thus are likely to exert disparate functions in promoting erythroid maturation (Stonestrom et al., 2015). That study, similar to the present one, also suggested functional overlap between BRD2 and BRD3. Several important questions remain for future studies. What is the molecular basis underlying the selective recruitment of BET proteins by distinct sets of transcription factors? Do CTCF sites co-bound by BRD2 have functions disparate from CTCF sites that do not recruit BRD2? To what degree can BRD2 form boundaries or architectural domains at places where CTCF is not also present? And, more broadly, what distinguishes CTCF and BRD2 sites at boundaries from those that lie in non-boundary chromatin? Finally, to what extent does this function of BRD2 relate to the organization of smaller scale structures such as enhancer-promoter loops?
In concert, our findings indicate that BRD2 acts to augment the boundary function of CTCF both by limiting the spread or range of enhancer activity, and by physically preventing the formation of cross-boundary contacts genome-wide (Figure 6). This implies that pharmacologic BET inhibitors may alter transcriptional regulation on a broader scale as a result of domain boundary perturbations.
Figure 6. BRD2 maintains the integrity of transcriptional and architectural boundaries.

Model depicting potential mechanisms by which BRD2 regulates boundary function with CTCF. CTCF recruits BRD2 to co-bound sites. Loss of BRD2 leads to both inappropriate co-regulation of genes normally insulated from one another, as well as an increase in ectopic interactions across domain boundaries.
STAR Methods
Contact for Reagent and Resource Sharing
Further information and requests for resources and reagents should be directed to and will be fulfilled by the Lead Contact, Gerd A. Blobel (blobel@email.chop.edu).
Experimental Model and Subject Details
G1E-ER4 cells are a sub-line of G1E cells, (derived from GATA1−/− murine embryonic stem cells (Weiss et al., 1997), which express GATA1 fused to the ligand binding domain of the estrogen receptor (GATA1-ER) introduced by a retrovirus (Weiss et al., 1997). GATA1 activation and erythroid maturation are induced by the addition of 100nM estradiol to the media for 24 hours (“+GATA1”). Where indicated, cells were used in the undifferentiated (“−GATA1”) state, and are referred to as “uninduced.” G1E-ER4 cells were grown in IMDM+15% FBS, penicillin/streptomycin, Kit ligand, monothioglycerol and epoetin alpha in a standard tissue culture incubator at 37C with 5% CO2.
For G1E-ER4 lines expressing HA-BRD2, cells were infected with MigR1-HA-BRD2 retrovirus, which contains IRES-GFP. HA-BRD2 was cloned into the MigR1 vector from mouse cDNA (Stonestrom et al., 2015). Following infection, cells were expanded and GFP+ cells were sorted on a FACS Aria II (BD Biosciences) to obtain pure populations.
BRD2-depleted (“BRD2 KO”) cell lines were derived by cotransfection of G1E-ER4 cells with MigR1-Cas9 (mCherry) and MigR1-guide RNA (GFP) targeting the Brd2 locus (BRD2_gRNA) using the Amaxa electroporator (Lonza). Single mCherry+/GFP+ cells were sorted 24 hours later into 96-well plates. Cells were expanded and clones were screened with a combination of PCR, Sanger sequencing and immunoblot.
Bcl11a-CTCF_Mut cell line was generated by co-transfection of G1E-ER4 cells with pX330-U6-Chimeric_BB-CBh-hSpCas9 Cas9/guide RNA plasmid (with GFP) (Paralkar et al., 2016) (a gift from Feng Zhang and Vikram Paralkar, Addgene plasmid 42230) with the Bcl11a_CTCF_gRNA cloned in, along with a mutated repair template (Bcl11a_CTCF_Mut_RepairTemplate, ssODN, 4nM Ultramer, IDT). Single cells were sorted, expanded as above, and screened using a combination of PCR, restriction digest and Sanger sequencing.
Slc25a37_CTCFa_Mut cell lines were derived by transfection with the pX330 Cas9/guide RNA plasmid as above with Slc25a37_CTCFa_Mut#1 or Mut#2 guide RNAs cloned in, and sorted and expanded as above. Clones were screened using PCR and Sanger sequencing, followed by ChIP-qPCR to confirm CTCF binding disruption. Allele sequences were determined by TOPO-TA cloning a PCR product encompassing the edited region, followed by sequencing.
See Key Resources Table for guide RNA and repair template sequences.
Method Details
Retroviral infection of murine cells
To generate G1E-ER4 cells stably expressing HA-BRD2, cells were infected with a MigR1-HA-BRD2 retrovirus. Retrovirus was produced as previously described in HEK293T (Tripic et al., 2009). Briefly, HEK293T were plated, grown to ~90% confluence in a 10cm dish, and transfected using the calcium phosphate method to co-introduce MigR1 and pCL-Eco packaging plasmids. 500ul of 2× transfection buffer (2× transfection buffer: 0.5mL 0.5M HEPES pH7.1, 4.05mL dH2O, 0.45mL 2M NaCl, 100ul of 100mM Na2HPO4) was mixed with 500ul DNA mixture (62.5ul 2M CaCl2, 50ul 10× NTE, 15ug MigR1 plasmid, 15ug pCL-Eco, up to 500ul with dH2O) drop-wise. This mixture was then added to cells and incubated at 37C. Media was changed 6 hours post-transfection. Viral supernatant was harvested 48 hours post-transfection. For retroviral infection, ~1–2 million G1E-ER4 cells were plated in 6-well plates with 1mL of media and 1mL of viral supernatant. The cationic polymer polybrene (8ug/ul) and 10mM HEPES were added and cells were spun for 90 minutes at 3200RPM at room temperature. Following infection, cells were replated in fresh media and expanded for sorting.
CRISPR/Cas9 genome editing
G1E-ER4 cells were transfected with Cas9 and guide RNA plasmids or a combined vector harboring both (see Experimental Models and Subject Details above), as well as a repair template if indicated, using the Amaxa II electroporator (Lonza) with program G-016 and reagent Kit R. Single cells were sorted into 96 well plates using a FACS Aria II (BD Biosciences), expanded, and screened by PCR, DNA sequencing, and ChIP or immunoblot as appropriate. Individual allele sequences were determined by PCR of the region surrounding the mutated site, followed by TOPO-TA cloning and Sanger sequencing. Guide RNA and repair template sequences (4nM Ultramer, IDT) are provided in the Key Resources Table. All guide RNA sequences were designed using the CRISPR design tool (crispr.mit.edu) (Cong and F. Zhang, 2014).
ChIP
Chromatin immunoprecipitation (ChIP) was performed using the following antibodies: CTCF (Millipore 07–729), BRD2 (Bethyl A302-583A), SMC1 (Bethyl A300-055A), and HA (12CA5).
G1E-ER4 cells (≥10 million per sample) were fixed in 1% formaldehyde in PBS at room temperature with agitation for 10 minutes, then quenched with 1M glycine for 5 minutes. Fixed cells were resuspended in 1mL Cell Lysis Buffer (10mM Tris pH 8, 10mM NaCl, 0.2% NP-40/Igepal) prepared fresh with protease inhibitors (Sigma P8340) and 1mM phenylmethylsulfonyl fluoride (PMSF) and incubated on ice for 10 minutes. Nuclei were pelleted and resuspended in 1mL Nuclear Lysis Buffer (50mM Tris pH 8, 10mM EDTA, 1% SDS, prepared fresh with protease inhibitors and PMSF), and incubated on ice for 20 minutes. Samples were then diluted with 0.6mL IP Dilution Buffer (20mM Tris pH 8, 2mM EDTA, 150mM NaCl, 1% Triton X-100, 0.01% SDS, prepared fresh with protease inhibitors and PMSF), and sonicated at 4C for 45 minutes (Epishear, Active Motif). After sonication, samples were spun at 21130×g for 5 minutes at 4C to remove debris and added to preclearing reactions containing 3.4mL IP Dilution Buffer, protein A/G agarose beads (agarose beads slurry was prepared by mixing Protein A (ThermoFisher 15918014) and Protein G (ThermoFisher 15920010) agarose beads at 1:1 ratio) and 50ug of isotope-matched IgG. Samples were precleared for ≥2 hours.
Prior to setting up immunoprecipitation (“IP”) reactions, 200ul of precleared chromatin was removed as “Input.” To set up IP reactions, precleared chromatin was added to protein A/G beads pre-bound with antibody and rotated overnight at 4C.
Beads were washed once with IP Wash 1 (20mM Tris pH 8, 2mM EDTA, 50 mM NaCl, 1% Triton X-100, 0.1% SDS), twice with High Salt Buffer (20 mM Tris pH 8, 2mM EDTA, 500 mM NaCl, 1% Triton X-100, 0.01% SDS), once with IP Wash Buffer 2 (10 mM Tris pH 8, 1mM EDTA, 0.25 M LiCI, 1% NP-40/Igepal, 1% sodium deoxycholate), and twice with TE (10mM Tris pH 8, 1mM EDTA pH 8). All washes were performed on ice. Following the final wash, beads were moved to room temperature and eluted twice with 100ul of Elution Buffer (100mM NaHCO3, 1%SDS, prepared fresh) for a final eluate volume of 200ul. The following were added to each IP and input sample: 12ul of 5M NaCl, 2ul RNaseA (10mg/ml, 10109169001 BMB) and samples were incubated at 65C for ≥1 hour. 3ul of proteinase K (20mg/ml, 3115879 BMB) was added and samples were incubated at 65C overnight.
Following overnight incubation, 10ul of 3M sodium acetate pH 5.2 was added to each sample and DNA was purified using the QIAquick PCR Purification kit (Qiagen 28106) per the manufacturer’s instructions.
ChIP-qPCR was performed with Power SYBR Green (ThermoFisher). Standard curves were constructed for each input sample and used to calculate the IP quantities for each primer set. Table S6 contains ChIP-qPCR primer sequences.
RT-qPCR
Cells were resuspended in 1mL Trizol (Life Technologies). RNA was isolated using the RNeasy Mini Kit (Qiagen). Reverse transcription was performed using 5× iScript Reverse Transcription Supermix (Bio-Rad). Quantitative PCR (qPCR) was performed using Power SYBR Green (ThermoFisher). Transcripts were normalized to Gapdh or β-actin as indicated. Table S6 contains RT-qPCR primer sequences.
3C
3C was performed as in (Deng et al., 2012). Briefly, 10 million cells were treated with estradiol for 24 hours, fixed with 1.5% formaldehyde at room temperature for 10 minutes, quenched with 250mM glycine, permeabilized in ice-cold hypotonic cell lysis buffer (10 mM Tris pH 8.0, 10 mM NaCl, 0.2% NP-40, protease inhibitors, 1 mM PMSF), and lysed in a dounce with 10 strokes of a type A pestle. Nuclei were spun down at 800×g, washed in ice-cold 1.2× digestion buffer 3.1 (New England BioLabs), and then resuspended in this same buffer. SDS was added to 0.3% and nuclei were shaken in a thermomixer (Eppendorf) at 950 rpm at 37C for 1 hour. Triton-X-100 was added to 1.8% and shaken at 950 rpm at 37C for 1 hour. To digest genomic DNA, 800 units of BglII (New England BioLabs) were added and samples were shaken overnight at 950 rpm at 37C. Next, SDS was added to 1.6% and samples were shaken at 950 rpm at 65C for 25 minutes. Samples were diluted in ligation buffer (50 mM Tris pH 7.5, 10 mM MgCl2, 1 mM ATP, 10 mM DTT, 1% Triton-X-100, and 100 ug/mL BSA) and incubated at 37C with occasional mixing. Genomic DNA fragments were ligated by adding 4,000 units of T4 DNA ligase (New England BioLabs) and incubating at 16C for 4 hours. EDTA was added to 10 mM to stop the reaction. Crosslinks and proteins were removed by incubating overnight at 65C with proteinase K. Nucleic acids were purified with phenol-chloroform, precipitated with ethanol, and resuspended in 10 mM Tris pH 8.0. RNA was removed by treating with RNaseA at 37C for 30 minutes. Finally, DNA was purified with phenol-chloroform, precipitated with ethanol, and resuspended in 10 mM Tris pH 8.0 by incubating at 55C for 10 minutes and 4C overnight.
Crosslinking frequencies between the anchor and baits were analyzed via Taqman qPCR. BglII digestion was assessed via qPCR (Power SYBR Green, ThermoFisher) of amplicons spanning the BglII sites and control amplicons adjacent to these sites. Primers and probes were designed using the online tool Primer3Plus (http://primer3plus.com). Specificity was confirmed using UCSC Genome Browser in silico PCR and NCBI Primer-BLAST. The presence of SNPs in G1E-ER4 cells relative to the mm9 reference genome was accounted for when selecting oligos and BglII sites. The Taqman qPCR signals were quantitated using a library of BglII digestion-ligation products derived from a BAC (BAC RP23-14E1 (Life Technologies, Cat # RPCI23.C, Clone ID: 14E1) spanning the relevant genomic region. Table S6 contains oligo sequences for 3C.
Immunoblotting
Nuclear lysates were prepared from indicated cell lines. Antibodies used were: BRD2 (Cell Signaling D89B4), and β-Actin-HRP (Sigma A3854).
Single-molecule RNA FISH imaging
We performed single-molecule RNA FISH as described previously (Femino et al., 1998; Raj et al., 2008; 2006). Briefly, we fixed cells in 1.85% formaldehyde in PBS for 10 minutes at room temperature, and stored them in 70% ethanol at 4C until imaging. FISH probes consisted of oligonucleotides complimentary to target mRNA, conjugated to fluorescent dyes: anti-Entpd4 oligos in Cy5, anti-Slc25a37 oligos in Cy3. We hybridized pools of FISH probes to samples, followed by DAPI staining and wash steps performed in suspension. Samples were cytospun onto slides for imaging on a Nikon Ti-E inverted fluorescence microscope. Table S6 contains sequences for RNA FISH probes.
ChIP-seq
ChIP-seq samples were prepared as described above for ChIP. All ChIP-seq samples were processed for library construction for Illumina sequencing using Illumina’s ChIP-seq Sample Preparation Kit. In brief, ChIP-enriched, fragmented DNA was subjected to end repair to generate blunt-end double stranded DNA, adenylation of 3′ ends, and adaptor ligation. Following ligation, SPRIselect (Beckman Coulter) beads were used at 0.9× and 0.6× for left and right side selection, respectively, to obtain an average library target size of ~300 bp. After size selection, fragments were amplified for 16 cycles, and PCR products were purified using Agencourt AMPureXP beads (Beckman Coulter). Sequencing was performed on an Illumina NextSeq 500 using Illumina’s reagents and kits as appropriate. Reads were mapped to mouse genome assembly mm9 using Bowtie. Reads were extended in the 3′ direction to 200bp using MACS to generate bigwig format files for browser display.
In situ HiC
10 million uninduced G1E-ER4 cells (−GATA1), either control or BRD2 KO clonal sublines, were fixed in 2% formaldehyde at room temperature for 10 minutes then quenched with 0.25M glycine for 5 minutes. Cells were washed with PBS, pelleted, resuspended in 1mL cold Cell Lysis Buffer (10mM Tris pH 8, 10mM NaCl, 0.2% NP-40/Igepal) and incubated on ice for 10 minutes. Nuclei were pelleted and washed once with 800ul of cold 1.2× NEB Buffer DpnII, pelleted and resuspended in 500ul 1.2× NEB Buffer DpnII. SDS was added to a final concentration of 0.3% and samples were incubated with shaking at 950rpm at 37C. 40ul of water was added to each sample, followed by 300U of DpnII (NEB R0543M), and samples were incubated overnight at 37C with shaking. An additional 300U of DpnII was added, and samples were incubated for 2 more hours at 37C, followed by incubation at 65C for 20 minutes. Nuclei were cooled on ice, pelleted and resuspended in 1× NEB Buffer2 with biotin-14-dATP, dCTP, dGTP, dTTP and DNA Polymerase I, Large (Klenow) Fragment (NEB M0210), and incubated at 37C with shaking for 1.5 hours. Fragments were ligated in a total volume of 1.2mL with T4 DNA Ligase (NEB) for 4 hours at 16C, then at room temperature for 30 minutes. Proteinase K (20ul of 20mg/mL) and SDS (120ul of 10% SDS) were added and crosslinks were reversed overnight at 65C. An additional 10ul of proteinase K was added and samples were incubated at 55C for 2 hours. DNase-free RNaseA was added and samples were incubated at 37C for 30 minutes. DNA was purified by phenol chloroform extraction.
To prepare the sequencing library, DNA was sonicated to 200–300bp fragments and purified using AMPure XP beads (Beckman Coulter). Ligation junctions were pulled down using streptavidin beads (50ul of Dynabeads MyOne Streptavidin C1 beads/10 million cells). Libraries were prepared using the NEBNext DNA Library Prep Master Mix Set for Illumina (NEB E6040, M0543L, E7335S) as per manufacturer’s instructions. Briefly, fragmented DNA was subjected to blunt end repair and dA tailing, followed by adaptor ligation. Following ligation, DNA was purified using AMPure XP beads (Beckman Coulter) and eluted in 15ul of water. Libraries were amplified for 6 cycles and PCR products were purified using AMPure XP beads. Sequencing was performed on an Illumina NextSeq 500.
Quantification and Statistical Analysis
ChIP-seq analysis: binding correlation and motifs
Mouse CTCF (in G1E or G1E-ER4 cells), RAD21 (MEL cells), and SMC3 (MEL cells) peak and aligned read (bam) files were downloaded from the Mouse ENCODE Project. BRD2, BRD3, and BRD4 ChIP-seq data were previously published by our laboratory (Stonestrom et al., 2015), as were RNA Pol II ChIP-seq data (Hsiung et al., 2016). Bigwig format files were visualized with the UCSC genome browser for track display (Meyer et al., 2012). Heatmap visualization of multiple tracks at CTCF sites was performed using the Cistrome (Liu et al., 2011) Galaxy (Giardine et al., 2005) analysis tool “Heatmap.”
Correlation of binding signal between factors at CTCF sites was determined by computing the RPKM for the indicated factors over CTCF peaks (+GATA1) using BEDTools (Quinlan and Hall, 2010) and calculating a Pearson correlation coefficient. Binned 2D scatter plots were generated using the function geom_bin2d in the R package ggplot2 (Wickham, 2009).
Motif analysis was performed using MEME-ChIP (Machanick and Bailey, 2011) for combined de novo motif analysis, comparison to a known motif database, and analysis of central enrichment in 500bp regions (centered at the middle of each peak using the UCSC genome browser mouse reference genome mm9). Motif analysis was performed on peak sets called using MACS (Feng et al., 2012; Y. Zhang et al., 2008) from induced G1E-ER4 cells (+GATA1).
RNA FISH image analysis
We manually segmented boundaries of cells from bright field images and localized RNA spots using custom software written in MATLAB (Raj et al., 2011) with subsequent analyses performed in R. All correlations were determined by the Spearman correlation test.
To examine whether unedited control G1E-ER4 cells could have a high biological correlation between the Entpd4 and Slc25a37 genes, which we might have failed to detect due to the relatively high impact of noise on the low numbers of Entpd4 RNA molecules per cell, we first computationally normalized the Entpd4 RNA counts from the control and CTCF mutant clones to the same low level. Since we observed that the change in mRNA level between control and Slc25a37-CTCFa-mutated cells was driven mainly by a change in burst frequency (unpublished observation), the increase in noise due to decreased burst frequency can be approximately modeled as a Poisson distribution (Raj et al., 2006). We then added increased noise to the computationally normalized data by drawing values from a Poisson distribution centered on the observed values. We then computed the correlation of Slc25a37 with these new, noisier values, and repeated this 10,000 times such that we could generate confidence intervals.
HiC read alignment and processing
Paired-end reads were aligned independently to mm9 mouse genome using bowtie2 (Langmead and Salzberg, 2012) (global parameters: –very-sensitive –L 30 –score-min L,−0.6,− 0.2 –end-to-end –reorder; local parameters: –very-sensitive –L 20 –score-min L,−0.6,−0.2 – end-to-end –reorder) through the HiC-Pro software (Servant et al., 2015). Unmapped reads, non-uniquely mapped reads and PCR duplicates were filtered and uniquely aligned reads were paired (Table S1). We initially performed two runs of sequencing on these libraries and found that the raw reads from biological replicates for each condition were highly correlated (Control_rep1 vs. Control_rep2 Spearman correlation coefficient: 0.83, BRD2KO#1_rep1 vs. BRD2KO#1_rep2 Spearman correlation coefficient: 0.77, BRD2KO#2_rep1 vs. BRD2KO#2_rep2 Spearman correlation coefficient: 0.77), demonstrating the reproducibility of the experiment and allowing us to merge the two replicates of each sample. To increase our sequencing depth we ultimately performed five total sequencing runs on these libraries. All subsequent analysis presented in the paper was performed on the full datasets pooling five sequencing runs with merged replicates for each sample. HiC maps were generated at 40kb and 10 kb matrix resolution and balanced using the iterative correction and eigenvector decomposition (ICED) technique (Imakaev et al., 2012). The lowest-interacting 10% of bins were removed prior to balancing to facilitate convergence. Matrices for all three conditions converged to a tolerance of 0.1 within 200 iterations.
Identifying BRD2, CTCF sites to classify boundaries
ChIP-seq peak calling was performed with MACS2 (Y. Zhang et al., 2008) using parameters for punctate (CTCF; -p 1E-8) and diffuse (BRD2; -p 1E-8 –broad –broad-cutoff 1e-4) chromatin marks. To address the challenge of peak calling BRD2 signal, we performed intersections to keep the enriched signal called with –broad-cutoff 1e-2 that also intersected peaks called with – broad-cutoff 1e-4. The result of this intersection is the detection of both punctate and diffuse BRD2 sites via the capture of the breadth of moderate-confidence BRD2 signal surrounding narrower high-confidence BRD2 peaks. To find genomic loci co-occupied by high-confidence CTCF and BRD2, we intersected CTCF and BRD2 peaks and vice-versa, and then the results of the intersections were concatenated and merged. To identify exclusively occupied sites, we subtracted low-confidence occupancy regions for CTCF from the high-confidence peak calls for BRD2 and vice-versa. We parsed low-confidence occupancy regions in the genome as zones of possible but low-signal binding using -p 1e-2 (CTCF) or –broad-cutoff 1e-2 (BRD2). The subtraction operations ensured that regions of moderate-confidence binding of either protein are excluded from the stringent exclusive site list.
Contact domain calling and categorization
Contact domains were identified in control uninduced G1E-ER4 cells by applying the directionality index (DI) and a Hidden Markov Model (Dixon et al., 2012). We called two sets of domains: one set on the 40kb interaction matrices, using a 50 bin (2Mb) window in both the upstream and downstream direction to compute the directionality index; and a second set on the 10kb interaction matrices, using a 100 bin (1Mb) directionality index window (boundary locations are provided in Tables S4 and S5). We defined domain boundaries as the endpoints of each domain called, except in cases where the next domain was over 400kb away, suggesting a stretch of generally disorganized chromatin rather than a specific boundary. Disorganized chromatin regions were not considered in downstream analyses. We detected 1,814 domains (median size 920kb) in our 40 kb contact matrices from control uninduced G1E-ER4 cells. Moreover, by using a smaller directionality index computation window (100 bins) on our higher resolution 10 kb contact matrices, we identified a larger set of 3,214 domains of smaller size (median size 470kb) in control cells, These results are consistent with the notion that large domains such as TADs are further arranged into a nested set of overlapping subdomains.
Control cell contact domain boundaries were then classified based on the presence or absence of nearby high-confidence CTCF and BRD2 ChIP-seq peaks. Boundaries were parsed into categories based on which combinations of these factors were found near the boundary, including: (1) those with BRD2 without CTCF, (2) those in which CTCF and BRD2 are directly co-localized, with no additional CTCF-only or BRD2-only sites (“CTCF/BRD2 co-occupied only”), (3) those in which CTCF and BRD2 are directly co-localized with additional BRD2-only sites (“CTCF/BRD2 co-occupied with BRD2-only”), (4) those in which CTCF and BRD2 are directly co-localized with additional CTCF-only sites (“CTCF/BRD2 co-occupied with CTCF-only”), (5) those with CTCF without BRD2, (6) those that lack either protein (“Neither”), and (7) all “Other” boundaries containing multiple classes of colocalized sites and/or peaks that did not meet our stringent thresholds. This “Other” category ensures the stringency of categories (1)–(6) by including cases where high-confidence BRD2 was present together with moderateconfidence CTCF (or vice-versa), as well as cases where exclusive CTCF and exclusive BRD2 sites were both found near the boundary call. When categorizing the boundaries of domains called on 40kb contact matrices, we considered ChIP-seq peaks within 20kb of the boundary coordinate, in accordance with the +/− 20kb uncertainty inherent in identifying a coordinate on a 40kb binned matrix. Similarly, when categorizing the boundaries of domains called on the 10kb contacted matrices, we considered ChIP-seq peaks within +/−20kb of the boundary coordinate. The number of boundaries classified into each category is shown in Tables S2 and S3.
Insulation score analysis
To enable comparison between samples, ICED corrected HiC libraries were parsed into contact matrices for each chromosome and then quantile normalized (Bolstad et al., 2003; Bullard et al., 2010). Bin-bin pairs with ICED values lower than 0.01 were excluded from quantile normalization and downstream analyses. Our normalization approach resulted in the equalization of global counts distributions across different samples while preserving underlying biological differences unique to each condition.
To assess the relative strength of contact domain boundaries using our 40kb contact matrices, we computed an insulation score as the sum of a 5 bin by 5 bin (200kb by 200kb) window positioned adjacent to the diagonal at the bin of interest as in (Crane et al., 2015). We positioned two windows over the bins immediately upstream and downstream of the boundary (“−1” and “+1”, respectively), and then slid the windows away from the boundary until they no longer overlapped a previous window. This allowed the boundary position to emerge as a relative minimum in insulation score relative to the surrounding chromatin context. To understand global trends, the insulation scores for each window position across boundaries were averaged within each boundary category and condition. Error bars were computed by taking the 2.5th and 97.5th percentile of the distribution of the sampling means generated via a bootstrapping procedure in which the insulation score values of boundaries in a particular class were sampled with replacement 1,000 times. A high insulation score over a bin implies that many contacts between the 200kb of chromatin directly downstream of the bin and the 200kb directly upstream of the bin pass over the bin, or equivalently, that the bin does not prevent contacts at this range from passing over the bin. Low values of insulation score correspond to well-insulated/strong boundaries. We repeated this insulation score analysis on our 10kb contact matrices, using a variety of window sizes. The results presented in Figure S6E and Figure S6F were obtained by precisely matching the insulation score window size (200kb by 200kb) and non-overlapping sliding window genomic positions to those used in the 40kb analysis.
To better understand the contributions of individual domain boundaries to the genome-wide trends shown in the insulation score line plots, the log2 fold change in insulation score between the BRD2 knockout (averaging over the two biological replicates) and control conditions was computed for each boundary, and these differences were collected for each boundary category. The collected quantities were then plotted as histograms (top row of Figure 5C, analysis of 40kb matrices, and Figure S6E, analysis of 10kb matrices). For comparison, we generated an empirical null distribution representing log2 fold changes in insulation score between the two BRD2 depleted conditions (BRD2 KO#1 and BRD2 kO#2), allowing the evaluation of the former histograms with respect to the level of noise in the assay (bottom row of Figure 5C, analysis of 40kb matrices, and Figure S6E, analysis of 10kb matrices). Within each category, we used this empirical null distribution to assign one-sided p-values for the log2 fold change in insulation score of each individual boundary in that category between BRD2 depleted and control conditions. To correct for multiple hypothesis testing, we applied the direct FDR procedure (Storey, 2002) and called boundaries as significantly strengthening or significantly weakening upon BRD2 depletion at 15% pFDR. The numbers of significantly changing boundaries within each category are provided in Table S2 (based on the 40kb contact matrices) and Table S3 (based on the 10kb contact matrices).
Data and Software Availability
ChIP-seq sequencing data have been deposited in GEO under the accession number GSE80527. HiC sequencing data will be deposited in GEO, accession number pending.
Supplementary Material
Acknowledgments
We thank members of the lab for helpful discussion and critical comments on the manuscript. This work was supported by an NCI F30 (F30CA189553) fellowship and Patel Family Scholar Award to S.C.H., an NIH GRFP fellowship to C.R.B., 5T32HL007439-37 to M.T.W., R56DK065806 and U54HG006998 to R.C.H., an NIH New Innovator Award 1DP2OD008514 to A.R., 1RO1DK54937 to G.A.B., R24DK106766 to G.A.B. and R.C.H., U01HL129998A to A.R., G.A.B., and J.E.P.C., the Alfred P. Sloan Foundation (to J.E.P.C.), a joint NSF-NIGMS grant (1562665) to support research at the interface of the biological and mathematical sciences to J.E.P.C., and a generous gift from the DiGaetano family to G.A.B. J.E.P.C. is a New York Stem Cell Foundation (NYSCF) Robertson Investigator.
Footnotes
Publisher's Disclaimer: This is a PDF file of an unedited manuscript that has been accepted for publication. As a service to our customers we are providing this early version of the manuscript. The manuscript will undergo copyediting, typesetting, and review of the resulting proof before it is published in its final citable form. Please note that during the production process errors may be discovered which could affect the content, and all legal disclaimers that apply to the journal pertain.
Author contributions
S.C.H., J.E.P.C., and G.A.B. conceived the study and designed experiments. S.C.H., C.R.B., C.R.E., P.H., M.W., and C.A.K. performed experiments. S.C.H., A.J.S., C.R.B., T.G.G., D.J.E., P.E., B.G, R.C.H., A.R., J.E.P.C. and G.A.B. analyzed data. S.C.H., J.E.P.C., and G.A.B. wrote the manuscript with input from all authors.
References
- Anders L, Guenther MG, Qi J, Fan ZP, Marineau JJ, Rahl PB n, JLE, Sigova AA, Smith WB, Lee TI, Bradner JE, Young RA. Genome-wide localization of small molecules. Nature Biotechnology. 2013;32:92–96. doi: 10.1038/nbt.2776. [DOI] [PMC free article] [PubMed] [Google Scholar]
- Asangani IA, Dommeti VL, Wang X, Malik R, Cieslik M, Yang R, Escara-Wilke J, Wilder-Romans K, Dhanireddy S, Engelke C, Iyer MK, Jing X, Wu YM, Cao X, Qin ZS, Wang S, Feng FY, Chinnaiyan AM. Therapeutic targeting of BET bromodomain proteins in castration-resistant prostate cancer. Nature. 2015;510:278–282. doi: 10.1038/nature13229. [DOI] [PMC free article] [PubMed] [Google Scholar]
- Belkina AC, Nikolajczyk BS, Denis GV. BET Protein Function Is Required for Inflammation: Brd2 Genetic Disruption and BET Inhibitor JQ1 Impair Mouse Macrophage Inflammatory Responses. The Journal of Immunology. 2013;190:3670–3678. doi: 10.4049/jimmunol.1202838. [DOI] [PMC free article] [PubMed] [Google Scholar]
- Berkovits BD, Wolgemuth DJ. The first bromodomain of the testis-specific double bromodomain protein Brdt is required for chromocenter organization that is modulated by genetic background. Developmental Biology. 2011;360:358–368. doi: 10.1016/j.ydbio.2011.10.005. [DOI] [PMC free article] [PubMed] [Google Scholar]
- Bolstad BM, Irizarry RA, Astrand M, Speed TP. A comparison of normalization methods for high density oligonucleotide array data based on variance and bias. Bioinformatics. 2003;19:185–193. doi: 10.1093/bioinformatics/19.2.185. [DOI] [PubMed] [Google Scholar]
- Bullard JH, Purdom E, Hansen KD, Dudoit S. Evaluation of statistical methods for normalization and differential expression in mRNA-Seq experiments. BMC Bioinformatics. 2010;11:94. doi: 10.1186/1471-2105-11-94. [DOI] [PMC free article] [PubMed] [Google Scholar]
- Chernukhin I, Shamsuddin S, Kang SY, Bergstrom R, Kwon YW, Yu W, Whitehead J, Mukhopadhyay R, Docquier F, Farrar D, Morrison I, Vigneron M, Wu SY, Chiang CM, Loukinov D, Lobanenkov V, Ohlsson R, Klenova E. CTCF Interacts with and Recruits the Largest Subunit of RNA Polymerase II to CTCF Target Sites GenomeWide. Molecular and Cellular Biology. 2007;27:1631–1648. doi: 10.1128/MCB.01993-06. [DOI] [PMC free article] [PubMed] [Google Scholar]
- Cong L, Zhang F. Methods in Molecular Biology, Methods in Molecular Biology. Springer; New York, New York, NY: 2014. Genome Engineering Using CRISPR-Cas9 System; pp. 197–217. [DOI] [PubMed] [Google Scholar]
- Crane E, Bian Q, McCord RP, Lajoie BR, Wheeler BS, Ralston EJ, Uzawa S, Dekker J, Meyer BJ. Condensin-driven remodelling of X chromosome topology during dosage compensation. Nature. 2015;523:240–244. doi: 10.1038/nature14450. [DOI] [PMC free article] [PubMed] [Google Scholar]
- Dawson MA, Prinjha RK, Dittmann A, Giotopoulos G, Bantscheff M, Chan WI, Robson SC, Chung CW, Hopf C, Savitski MM, Huthmacher C, Gudgin E, Lugo D, Beinke S, Chapman TD, Roberts EJ, Soden PE, Auger KR, Mirguet O, Doehner K, Delwel R, Burnett AK, Jeffrey P, Drewes G, Lee K, Huntly BJP, Kouzarides T. Inhibition of BET recruitment to chromatin as an effective treatment for MLL-fusion leukaemia. Nature. 2011;478:529–533. doi: 10.1038/nature10509. [DOI] [PMC free article] [PubMed] [Google Scholar]
- de Wit E, Vos ESM, Holwerda SJB, Valdes-Quezada C, Verstegen MJAM, Teunissen H, Splinter E, Wijchers PJ, Krijger PHL, de Laat W. CTCF Binding Polarity Determines Chromatin Looping. Mol Cell. 2015:1–10. doi: 10.1016/j.molcel.2015.09.023. [DOI] [PubMed] [Google Scholar]
- Deng W, Lee J, Wang H, Miller J, Reik A, Gregory PD, Dean A, Blobel GA. Controlling long-range genomic interactions at a native locus by targeted tethering of a looping factor. Cell. 2012;149:1233–1244. doi: 10.1016/j.cell.2012.03.051. [DOI] [PMC free article] [PubMed] [Google Scholar]
- Denis GV, McComb ME, Faller DV, Sinha A, Romesser PB, Costello CE. Identification of Transcription Complexes that Contain the Double Bromodomain Protein Brd2 and Chromatin Remodeling Machines. J Proteome Res. 2006;5:502–511. doi: 10.1021/pr050430u. [DOI] [PMC free article] [PubMed] [Google Scholar]
- Devaiah BN, Case-Borden C, Gegonne A, Hsu CH, Chen Q, Meerzaman D, Dey A, Ozato K, Singer DS. BRD4 is a histone acetyltransferase that evicts nucleosomes from chromatin. Nature Structural & Molecular Biology. 2016;23:540–548. doi: 10.1038/nsmb.3228. [DOI] [PMC free article] [PubMed] [Google Scholar]
- Dixon JR, Selvaraj S, Yue F, Kim A, Li Y, Shen Y, Hu M, Liu JS, Ren B. Topological domains in mammalian genomes identified by analysis of chromatin interactions. Nature. 2012;485:376–380. doi: 10.1038/nature11082. [DOI] [PMC free article] [PubMed] [Google Scholar]
- Durant M, Pugh BF. NuA4-Directed Chromatin Transactions throughout the Saccharomyces cerevisiae Genome. Molecular and Cellular Biology. 2007;27:5327–5335. doi: 10.1128/MCB.00468-07. [DOI] [PMC free article] [PubMed] [Google Scholar]
- Femino AM, Fay FS, Fogarty K, Singer RH. Visualization of single RNA transcripts in situ. Science. 1998;280:585–590. doi: 10.1126/science.280.5363.585. [DOI] [PubMed] [Google Scholar]
- Feng J, Liu T, Qin B, Zhang Y, Liu XS. Identifying ChIP-seq enrichment using MACS. Nature Protocols. 2012;7:1728–1740. doi: 10.1038/nprot.2012.101. [DOI] [PMC free article] [PubMed] [Google Scholar]
- Filippakopoulos P, Qi J, Picaud S, Shen Y, Smith WB, Fedorov O, Morse EM, Keates T, Hickman TT, Felletar I, Philpott M, Munro S, McKeown MR, Wang Y, Christie AL, West N, Cameron MJ, Schwartz B, Heightman TD, La Thangue N, French CA, Wiest O, Kung AL, Knapp S, Bradner JE. Selective inhibition of BET bromodomains. Nature. 2010;468:1067–1073. doi: 10.1038/nature09504. [DOI] [PMC free article] [PubMed] [Google Scholar]
- Flavahan WA, Drier Y, Liau BB, Gillespie SM, Venteicher AS, Stemmer-Rachamimov AO, Suva ML, Bernstein BE. Insulator dysfunction and oncogene activation in IDH mutant gliomas. Nature. 2015:1–16. doi: 10.1038/nature16490. [DOI] [PMC free article] [PubMed] [Google Scholar]
- Garcia-Gutierrez P, Mundi M, Garcia-Dominguez M. Association of bromodomain BET proteins with chromatin requires dimerization through the conserved motif B. J Cell Sci. 2012;125:3671–3680. doi: 10.1242/jcs.105841. [DOI] [PubMed] [Google Scholar]
- Giardine B, Riemer C, Hardison RC, Burhans R, Elnitski L, Shah P, Zhang Y, Blankenberg D, Albert I, Taylor J, Miller W, Kent WJ, Nekrutenko A. Galaxy: a platform for interactive large-scale genome analysis. Genome Research. 2005;15:1451–1455. doi: 10.1101/gr.4086505. [DOI] [PMC free article] [PubMed] [Google Scholar]
- Guo Y, Xu Q, Canzio D, Shou J, Li J, Gorkin DU, Jung I, Wu H, Zhai Y, Tang Y, Lu Y, Wu Y, Jia Z, Li W, Zhang MQ, Ren B, Krainer AR, Maniatis T, Wu Q. CRISPR Inversion of CTCF Sites Alters Genome Topology and Enhancer/Promoter Function. Cell. 2015;162:900–910. doi: 10.1016/j.cell.2015.07.038. [DOI] [PMC free article] [PubMed] [Google Scholar]
- Hsiung CCS, Bartman CR, Huang P, Ginart P, Stonestrom AJ, Keller CA, Face C, Jahn KS, Evans P, Sankaranarayanan L, Giardine B, Hardison RC, Raj A, Blobel GA. A hyperactive transcriptional state marks genome reactivation at the mitosis–G1 transition. Genes & Development. 2016;30:1423–1439. doi: 10.1101/gad.280859.116. [DOI] [PMC free article] [PubMed] [Google Scholar]
- Huang B, Yang XD, Zhou MM, Ozato K, Chen LF. Brd4 Coactivates Transcriptional Activation of NF-B via Specific Binding to Acetylated RelA. Molecular and Cellular Biology. 2009;29:1375–1387. doi: 10.1128/MCB.01365-08. [DOI] [PMC free article] [PubMed] [Google Scholar]
- Huang J, Liu X, Li D, Shao Z, Cao H, Zhang Y, Trompouki E, Bowman TV, Zon LI, Yuan GC, Orkin SH, Xu J. Dynamic Control of Enhancer Repertoires Drives Lineage and Stage-Specific Transcription during Hematopoiesis. Developmental Cell. 2016;36:9–23. doi: 10.1016/j.devcel.2015.12.014. [DOI] [PMC free article] [PubMed] [Google Scholar]
- Hughes JR, Roberts N, McGowan S, Hay D, Giannoulatou E, Lynch M, De Gobbi M, Taylor S, Gibbons R, Higgs DR. Analysis of hundreds of cis-regulatory landscapes at high resolution in a single, high-throughput experiment. Nature Publishing Group. 2014;46:205–212. doi: 10.1038/ng.2871. [DOI] [PubMed] [Google Scholar]
- Imakaev M, Fudenberg G, McCord RP, Naumova N, Goloborodko A, Lajoie BR, Dekker J, Mirny LA. Iterative correction of Hi-C data reveals hallmarks of chromosome organization. Nat Meth. 2012;9:999–1003. doi: 10.1038/nmeth.2148. [DOI] [PMC free article] [PubMed] [Google Scholar]
- Kellner WA, Van Bortle K, Li L, Ramos E, Takenaka N, Corces VG. Distinct isoforms of the Drosophila Brd4 homologue are present at enhancers, promoters and insulator sites. Nucleic Acids Research. 2013;41:9274–9283. doi: 10.1093/nar/gkt722. [DOI] [PMC free article] [PubMed] [Google Scholar]
- Ladurner AG, Inouye C, Jain R, Tjian R. Bromodomains mediate an acetyl-histone encoded antisilencing function at heterochromatin boundaries. Mol Cell. 2003;11:365–376. doi: 10.1016/s1097-2765(03)00035-2. [DOI] [PubMed] [Google Scholar]
- Lamonica JM, Deng W, Kadauke S, Campbell AE, Gamsjaeger R, Wang H, Cheng Y, Billin AN, Hardison RC, Mackay JP, Blobel GA. Bromodomain protein Brd3 associates with acetylated GATA1 to promote its chromatin occupancy at erythroid target genes. Proceedings of the National Academy of Sciences. 2011;108:E159–68. doi: 10.1073/pnas.1102140108. [DOI] [PMC free article] [PubMed] [Google Scholar]
- Langmead B, Salzberg SL. Fast gapped-read alignment with Bowtie 2. Nat Meth. 2012;9:357–359. doi: 10.1038/nmeth.1923. [DOI] [PMC free article] [PubMed] [Google Scholar]
- Li L, Lyu X, Hou C, Takenaka N, Nguyen HQ, Ong CT, Cubeñas-Potts C, Hu M, Lei EP, Bosco G, Qin ZS, Corces VG. Widespread Rearrangement of 3D Chromatin Organization Underlies Polycomb-Mediated Stress-Induced Silencing. Mol Cell. 2015;58:216–231. doi: 10.1016/j.molcel.2015.02.023. [DOI] [PMC free article] [PubMed] [Google Scholar]
- Liu T, Ortiz JA, Taing L, Meyer CA, Lee B, Zhang Y, Shin H, Wong SS, Ma J, Lei Y, Pape UJ, Poidinger M, Chen Y, Yeung K, Brown M, Turpaz Y, Liu XS. Cistrome: an integrative platform for transcriptional regulation studies. Genome Biol. 2011;12:R83. doi: 10.1186/gb-2011-12-8-r83. [DOI] [PMC free article] [PubMed] [Google Scholar]
- Lovén J, Hoke HA, Lin CY, Lau A, Orlando DA, Vakoc CR, Bradner JE, Lee TI, Young RA. Selective Inhibition ofTumor Oncogenes by Disruption of SuperEnhancers. Cell. 2013;153:320–334. doi: 10.1016/j.cell.2013.03.036. [DOI] [PMC free article] [PubMed] [Google Scholar]
- Lupiáñez DG, Kraft K, Heinrich V, Krawitz P, Brancati F, Klopocki E, Horn D, Kayserili H, Opitz JM, Laxova R, Santos-Simarro F, Gilbert-Dussardier B, Wittler L, Borschiwer M, Haas SA, Osterwalder M, Franke M, Timmermann B, Hecht J, Spielmann M, Visel A, Mundlos S. Disruptions of Topological Chromatin Domains Cause Pathogenic Rewiring of Gene-Enhancer Interactions. Cell. 2015;161:1012–1025. doi: 10.1016/j.cell.2015.04.004. [DOI] [PMC free article] [PubMed] [Google Scholar]
- Machanick P, Bailey TL. MEME-ChIP: motif analysis of large DNA datasets. Bioinformatics. 2011;27:1696–1697. doi: 10.1093/bioinformatics/btr189. [DOI] [PMC free article] [PubMed] [Google Scholar]
- Meyer LR, Zweig AS, Hinrichs AS, Karolchik D, Kuhn RM, Wong M, Sloan CA, Rosenbloom KR, Roe G, Rhead B, Raney BJ, Pohl A, Malladi VS, Li CH, Lee BT, Learned K, Kirkup V, Hsu F, Heitner S, Harte RA, Haeussler M, Guruvadoo L, Goldman M, Giardine BM, Fujita PA, Dreszer TR, Diekhans M, Cline MS, Clawson H, Barber GP, Haussler D, Kent WJ. The UCSC Genome Browser database: extensions and updates 2013. Nucleic Acids Research. 2012;41:D64–D69. doi: 10.1093/nar/gks1048. [DOI] [PMC free article] [PubMed] [Google Scholar]
- Narendra V, Rocha PP, An D, Raviram R, Skok JA, Mazzoni EO, Reinberg D. CTCF establishes discrete functional chromatin domains at the. Science. 2015;347:1017–1021. doi: 10.1126/science.1262088. [DOI] [PMC free article] [PubMed] [Google Scholar]
- Nora EP, Lajoie BR, Schulz EG, Giorgetti L, Okamoto I, Servant N, Piolot T, van Berkum NL, Meisig J, Sedat J, Gribnau J, Barillot E, Blüthgen N, Dekker J, Heard E. Spatial partitioning of the regulatory landscape of the X-inactivation centre. Nature. 2012;485:381–385. doi: 10.1038/nature11049. [DOI] [PMC free article] [PubMed] [Google Scholar]
- Padovan-Merhar O, Nair GP, Biaesch AG, Mayer A, Scarfone S, Foley SW, Wu AR, Churchman LS, Singh A, Raj A. Single Mammalian Cells Compensate for Differences in Cellular Volume and DNA Copy Number through Independent Global Transcriptional Mechanisms. Mol Cell. 2015;58:339–352. doi: 10.1016/j.molcel.2015.03.005. [DOI] [PMC free article] [PubMed] [Google Scholar]
- Paralkar VR, Taborda CC, Huang P, Yao Y, Kossenkov AV, Prasad R, Luan J, Davies JOJ, Hughes JR, Hardison RC, Blobel GA, Weiss MJ. Unlinking an lncRNA from Its Associated cis Element. Mol Cell. 2016;62:104–110. doi: 10.1016/j.molcel.2016.02.029. [DOI] [PMC free article] [PubMed] [Google Scholar]
- Parelho V, Hadjur S, Spivakov M, Leleu M, Sauer S, Gregson HC, Jarmuz A, Canzonetta C, Webster Z, Nesterova T, Cobb BS, Yokomori K, Dillon N, Aragon L, Fisher AG, Merkenschlager M. Cohesins Functionally Associate with CTCF on Mammalian Chromosome Arms. Cell. 2008;132:422–433. doi: 10.1016/j.cell.2008.01.011. [DOI] [PubMed] [Google Scholar]
- Phillips JE, Corces VG. CTCF: Master Weaver of the Genome. Cell. 2009;137:1194–1211. doi: 10.1016/j.cell.2009.06.001. [DOI] [PMC free article] [PubMed] [Google Scholar]
- Phillips-Cremins JE, Sauria MEG, Sanyal A, Gerasimova TI, Lajoie BR, Bell JSK, Ong CT, Hookway TA, Guo C, Sun Y, Bland MJ, Wagstaff W, Dalton S, McDevitt TC, Sen R, Dekker J, Taylor J, Corces VG. Architectural Protein Subclasses Shape 3D Organization of Genomesduring Lineage Commitment. Cell. 2013;153:1281–1295. doi: 10.1016/j.cell.2013.04.053. [DOI] [PMC free article] [PubMed] [Google Scholar]
- Quinlan AR, Hall IM. BEDTools: a flexible suite of utilities for comparing genomic features. Bioinformatics. 2010;26:841–842. doi: 10.1093/bioinformatics/btq033. [DOI] [PMC free article] [PubMed] [Google Scholar]
- Rahman S, Sowa ME, Ottinger M, Smith JA, Shi Y, Harper JW, Howley PM. The Brd4 Extraterminal Domain Confers Transcription Activation Independent of pTEFb by Recruiting Multiple Proteins, Including NSD3. Molecular and Cellular Biology. 2011;31:2641–2652. doi: 10.1128/MCB.01341-10. [DOI] [PMC free article] [PubMed] [Google Scholar]
- Raj A, Peskin CS, Tranchina D, Vargas DY, Tyagi S. Stochastic mRNA Synthesis in Mammalian Cells. PLoS Biol. 2006;4:e309. doi: 10.1371/journal.pbio.0040309.sv002. [DOI] [PMC free article] [PubMed] [Google Scholar]
- Raj A, Rifkin SA, Andersen E, van Oudenaarden A. Variability in gene expression underlies incomplete penetrance. Nature. 2011;463:913–918. doi: 10.1038/nature08781. [DOI] [PMC free article] [PubMed] [Google Scholar]
- Raj A, van den Bogaard P, Rifkin SA, van Oudenaarden A, Tyagi S. Imaging individual mRNA molecules using multiple singly labeled probes. Nat Meth. 2008;5:877–879. doi: 10.1038/nmeth.1253. [DOI] [PMC free article] [PubMed] [Google Scholar]
- Rao SSP, Huntley MH, Durand NC, Stamenova EK, Bochkov ID, Robinson JT, Sanborn AL, Machol I, Omer AD, Lander ES, Aiden EL. A 3D Map of the Human Genome at Kilobase Resolution Reveals Principles of Chromatin Looping. Cell. 2014;159:1665–1680. doi: 10.1016/j.cell.2014.11.021. [DOI] [PMC free article] [PubMed] [Google Scholar]
- Roe JS, Mercan F, Rivera K, Pappin DJ, Vakoc CR. BET Bromodomain Inhibition Suppresses the Function of Hematopoietic Transcription Factors in Acute Myeloid Leukemia. Mol Cell. 2015;58:1028–1039. doi: 10.1016/j.molcel.2015.04.011. [DOI] [PMC free article] [PubMed] [Google Scholar]
- Seitan VC, Faure AJ, Zhan Y, McCord RP, Lajoie BR, Ing-Simmons E, Lenhard B, Giorgetti L, Heard E, Fisher AG, Flicek P, Dekker J, Merkenschlager M. Cohesin-based chromatin interactions enable regulated gene expression within preexisting architectural compartments. Genome Research. 2013;23:2066–2077. doi: 10.1101/gr.161620.113. [DOI] [PMC free article] [PubMed] [Google Scholar]
- Servant N, Varoquaux N, Lajoie BR, Viara E, Chen CJ, Vert JP, Heard E, Dekker J, Barillot E. HiC-Pro: an optimized and flexible pipeline for Hi-C data processing. Genome Biol. 2015;16:11. doi: 10.1186/s13059-015-0831-x. [DOI] [PMC free article] [PubMed] [Google Scholar]
- Shang E, Nickerson HD, Wen D, Wang X, Wolgemuth DJ. The first bromodomain of Brdt, a testis-specific member of the BET sub-family of double-bromodomain-containing proteins, is essential for male germ cell differentiation. Development. 2007;134:3507–3515. doi: 10.1242/dev.004481. [DOI] [PubMed] [Google Scholar]
- Shaw GC, Cope JJ, Li L, Corson K, Hersey C, Ackermann GE, Gwynn B, Lambert AJ, Wingert RA, Traver D, Trede NS, Barut BA, Zhou Y, Minet E, Donovan A, Brownlie A, Balzan R, Weiss MJ, Peters LL, Kaplan J, Zon LI, Paw BH. Mitoferrin is essential for erythroid iron assimilation. Nat Cell Biol. 2006;440:96–100. doi: 10.1038/nature04512. [DOI] [PubMed] [Google Scholar]
- Shi J, Wang Y, Zeng L, Wu Y, Deng J, Zhang Q, Lin Y, Li J, Kang T, Tao M, Rusinova E, Zhang G, Wang C, Zhu H, Yao J, Zeng YX, Evers BM, Zhou MM, Zhou BP. Disrupting the Interaction of BRD4with Diacetylated Twist Suppresses Tumorigenesis in Basal-like Breast Cancer. Cancer Cell. 2014;25:210–225. doi: 10.1016/j.ccr.2014.01.028. [DOI] [PMC free article] [PubMed] [Google Scholar]
- Sofueva S, Yaffe E, Chan WC, Georgopoulou D, Rudan MV, Mira-Bontenbal H, Pollard SM, Schroth GP, Tanay A, Hadjur S. Cohesin-mediated interactions organize chromosomal domain architecture. EMBO J. 2013;32:3119–3129. doi: 10.1038/emboj.2013.237. [DOI] [PMC free article] [PubMed] [Google Scholar]
- Stonestrom AJ, Hsu SC, Jahn KS, Huang P, Keller CA, Giardine BM, Kadauke S, Campbell AE, Evans P, Hardison RC, Blobel GA. Functions of BET proteins in erythroid gene expression. Blood. 2015;125:2825–2834. doi: 10.1182/blood-2014-10-607309. [DOI] [PMC free article] [PubMed] [Google Scholar]
- Storey JD. A direct approach to false discovery rates. Journal of the Royal Statistical Society: Series B 2002 [Google Scholar]
- Surface LE, Fields PA, Subramanian V, Behmer R, Udeshi N, Peach SE, Carr SA, Jaffe JD, Boyer LA. H2A.Z.1 Monoubiquitylation Antagonizes BRD2 to Maintain Poised Chromatin in ESCs. CellReports. 2016;14:1142–1155. doi: 10.1016/j.celrep.2015.12.100. [DOI] [PMC free article] [PubMed] [Google Scholar]
- Symmons O, Uslu VV, Tsujimura T, Ruf S, Nassari S, Schwarzer W, Ettwiller L, Spitz F. Functional and topological characteristics of mammalian regulatory domains. Genome Research. 2014;24:390–400. doi: 10.1101/gr.163519.113. [DOI] [PMC free article] [PubMed] [Google Scholar]
- Szabo PE, Tang SHE, Silva FJ, Tsark WMK, Mann JR. Role of CTCF Binding Sites in the Igf2/H19 Imprinting Control Region. Molecular and Cellular Biology. 2004;24:4791–4800. doi: 10.1128/MCB.24.11.4791-4800.2004. [DOI] [PMC free article] [PubMed] [Google Scholar]
- Tripic T, Deng W, Cheng Y, Zhang Y, Vakoc CR, Gregory GD, Hardison RC, Blobel GA. SCL and associated proteins distinguish active from repressive GATA transcription factor complexes. Blood. 2009;113:2191–2201. doi: 10.1182/blood-2008-07-169417. [DOI] [PMC free article] [PubMed] [Google Scholar]
- Vardabasso C, Gaspar-Maia A, Hasson D, Pünzeler S, Valle-Garcia D, Straub T, Keilhauer EC, Strub T, Dong J, Panda T, Chung CY, Yao JL, Singh R, Segura MF, Fontanals-Cirera B, Verma A, Mann M, Hernando E, Hake SB, Bernstein E. Histone Variant H2A.Z.2 Mediates Proliferation and Drug Sensitivity of Malignant Melanoma. Mol Cell. 2015;59:75–88. doi: 10.1016/j.molcel.2015.05.009. [DOI] [PMC free article] [PubMed] [Google Scholar]
- Wang R, Li Q, Helfer CM, Jiao J, You J. Bromodomain Protein Brd4 Associated with Acetylated Chromatin Is Important for Maintenance of Higher-order Chromatin Structure. Journal of Biological Chemistry. 2012;287:10738–10752. doi: 10.1074/jbc.M111.323493. [DOI] [PMC free article] [PubMed] [Google Scholar]
- Weiss MJ, Yu C, Orkin SH. Erythroid-cell-specific properties of transcription factor GATA-1 revealed by phenotypic rescue of a gene-targeted cell line. Molecular and Cellular Biology. 1997;17:1642–1651. doi: 10.1128/mcb.17.3.1642. [DOI] [PMC free article] [PubMed] [Google Scholar]
- Welch JJ. Global regulation of erythroid gene expression by transcription factor GATA-1. Blood. 2004;104:3136–3147. doi: 10.1182/blood-2004-04-1603. [DOI] [PubMed] [Google Scholar]
- Wendt KS, Yoshida K, Itoh T, Bando M, Koch B, Schirghuber E, Tsutsumi S, Nagae G, Ishihara K, Mishiro T, Yahata K, Imamoto F, Aburatani H, Nakao M, Imamoto N, Maeshima K, Shirahige K, Peters JM. Cohesin mediates transcriptional insulation by CCCTC-binding factor. Nature. 2008;451:796–801. doi: 10.1038/nature06634. [DOI] [PubMed] [Google Scholar]
- Wu SY, Lee AY, Lai HT, Zhang H, Chiang CM. Phospho Switch Triggers Brd4 Chromatin Binding and Activator Recruitmentfor Gene-Specific Targeting. Mol Cell. 2013;49:843–857. doi: 10.1016/j.molcel.2012.12.006. [DOI] [PMC free article] [PubMed] [Google Scholar]
- Zhang Y, Liu T, Meyer CA, Eeckhoute J, Johnson DS, Bernstein BE, Nussbaum C, Myers RM, Brown M, Li W, Liu XS. Model-based Analysis of ChIP-Seq (MACS) Genome Biol. 2008;9:R137. doi: 10.1186/gb-2008-9-9-r137. [DOI] [PMC free article] [PubMed] [Google Scholar]
- Zhao R, Nakamura T, Fu Y, Lazar Z, Spector DL. Gene bookmarking accelerates the kinetics of post-mitotic transcriptional re-activation. Nat Cell Biol. 2011;13:1295–1304. doi: 10.1038/ncb2341. [DOI] [PMC free article] [PubMed] [Google Scholar]
- Zuin J, Dixon JR, van der Reijden MIJA, Ye Z, Kolovos P, Brouwer RWW, van de Corput MPC, van de Werken HJG, Knoch TA, van IJcken WFJ, Grosveld FG, Ren B, Wendt KS. Cohesin and CTCF differentially affect chromatin architecture and gene expression in human cells. Proceedings of the National Academy of Sciences. 2014;111:996–1001. doi: 10.1073/pnas.1317788111. [DOI] [PMC free article] [PubMed] [Google Scholar]
Associated Data
This section collects any data citations, data availability statements, or supplementary materials included in this article.