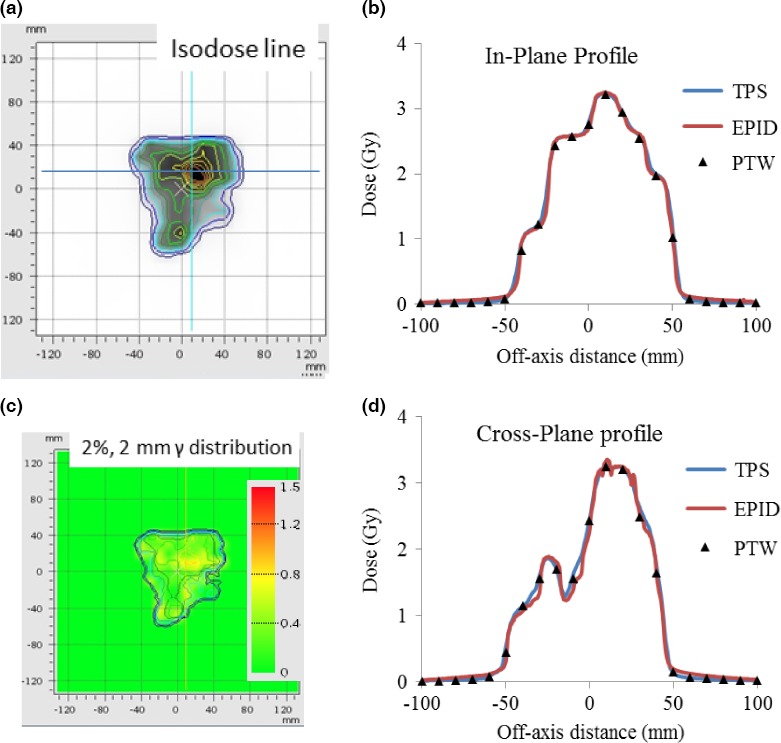
Figure 7.

Patient case 2, 15 MV VMAT plan measured with EPID attached to the gantry: (a) Isodose line overlay of EPID measurement and TPS calculation; (b) In‐plane profiles of EPID, PTW729 measurements and TPS calculation; (c) 2 mm/2% γ‐index (between EPID measurements and TPS calculation) distribution map; and (d) Cross‐plane profiles of EPID, PTW729 measurements, and TPS calculation.
