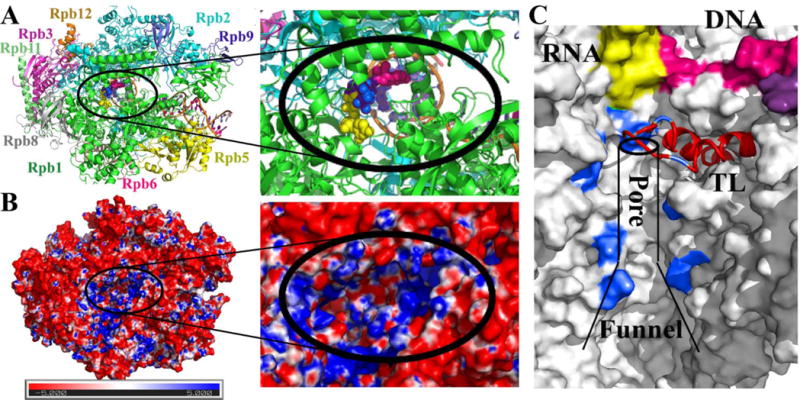
Figure 1. RNA polymerase II structure, electrostatics, and secondary pore.

10-subunit S. cerevisiae Pol II complex with open trigger loop and the three initial UTP sites (shown as spheres colored yellow, blue, and pink) that were used as the starting models in this study. Colors distinguish different subunits (Rpb1–4, 5–6, 8–12) and nucleic acid components (A). Electrostatic potential in the secondary pore projected onto the molecular surface according to the Poisson-Boltzmann equation calculated via APBS [30] with red and blue colors indicating negative and positive potentials respectively (B). Secondary pore with the nascent RNA shown in yellow, residues lining the pore used to define the NTP position within the pore (cf. Section 2.1) in blue, and the trigger loop in red (C).
